Is your portfolio built for the new investing era?
Nobody knows what the next decade may bring. However, it is fair to say that after a 40 year period of falling rates, buy-the-dip, disinflation, globalization, etc. that we could be at the start of a new era.
Fundamental economic shifts could lead to a new era of rising rates and higher inflation. Indeed, correlations we depend on as investors might change. The typical 60/40 portfolio is based on the idea that stocks and bonds have negative (or low) correlations. However, this was not always so.
The following chart from Artemis Capital shows the evolving correlation between stocks and bonds over the past 100+ years: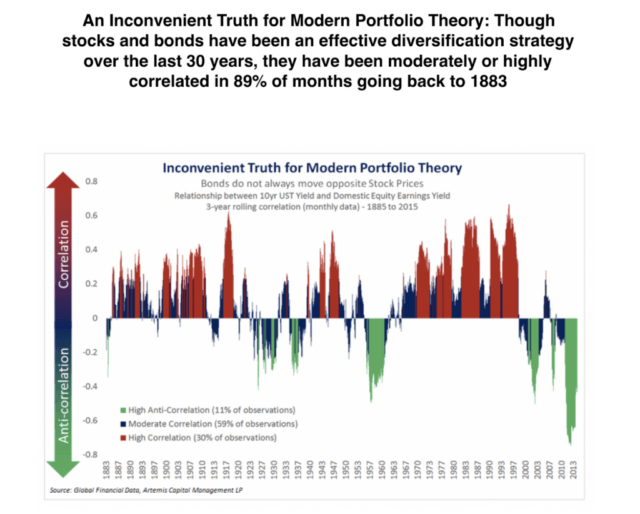
Source: Artemis Capital Management
Unfortunately after 30-40 years of experience the entire wealth management industry is built on the general assumptions behind the traditional 60/40 portfolio. Whether you buy a pre-made portfolio, work with an advisor or build your own portfolio, you need to consider the assumed correlations that are embedded in your asset allocation.
The chart below (source: St Louis Federal Reserve) distinctly illustrates two economic eras with 1981 being the break point. Unfortunately, most portfolio construction decisions are based on data from the second era. While these assumptions worked well over the past 30-40 years, they could become portfolio killers in the future.
It can be argued that the single driving factor behind asset returns over the past few decades was disinflation. Relentless disinflation allowed interest rates to continuously decline. That combined with low correlations provided a tailwind to the 60/40 portfolio.
The single factor that could break this trend and return the world to an era of rising rates is inflation. Inflation would create a headwind for both stocks and bonds, possibly eroding returns, increasing correlations and breaking the standard 60/40 portfolio.
Source: St Louis Federal Reserve
To get a better understanding how various portfolios might perform during different economic eras, below I examined four different portfolios using data going back to 1970. This data incorporates both the inflationary period leading up to 1981 and the dis-inflationary period since.
1. All Stock Portfolio
This portfolio is 100% comprised of US stocks. While it might sound aggressive, many DIY portfolios fit this description. For some, stocks are the only asset class.
2. Traditional 60/40 Portfolio
This portfolio splits allocation between the total US equity market and intermediate bonds. Although there are countless variations of the 60/40 portfolio, a huge portion of retail investor asset allocations generally align with this portfolio structure. This portfolio was widely promoted by John Bogle to his numerous followers. It has been adopted (and adapted) by almost all of the asset management industry, as it has proved to work well over the past few decades.
3. Permanent Portfolio
This portfolio was first proposed by investment advisor Harry Browne. He created this portfolio of growth stocks, precious metals, government bonds, and Treasury bills to provide stable returns through any economic cycle. This portfolio is the first in this examination that introduces a structure that might perform well during a new economic era. Again, there are many variations of this portfolio.
4. Golden Butterfly Portfolio
Like the Permanent Portfolio, this portfolio is meant to perform well during all economic environments. This portfolio is meant to provide the higher returns associated with the All Stock Portfolio, but the lower risk levels associated with the Permanent Portfolio.
The stacked bar chart below shows the breakdown for each portfolio. Below that are some options for fulfilling each of the individual components using a variety of ETFs. The remainder of this article examines the risk/return profile for each portfolio.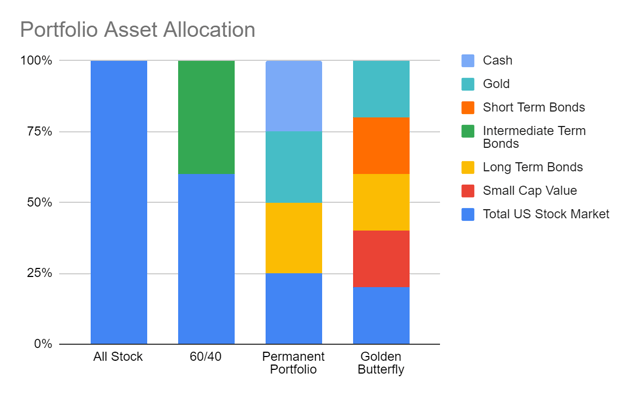
Source: DumbWealth.com, PortfolioCharts
These are just some examples of what could be within each of the asset sleeves.
Cash: iShares Short Treasury Bond ETF (SHV)
Gold: iShares Gold Trust (IAU) or SPDR Gold Trust (GLD)
Short Term Bonds: iShares 1-3 Year Treasury Bond ETF (SHY)
Intermediate Term Bonds: Vanguard Intermediate-Term Corporate Bond ETF (VCIT) or iShares 7-10 Year Treasury Bond ETF (IEF)
Long Term Bonds: iShares 20+ Year Treasury Bond ETF (TLT) or Vanguard Long-Term Bond ETF (BLV)
Small Cap Value: Vanguard Small Cap ETF (VB)
Total US Stock Market: Vanguard Total Stock Market ETF (VTI) or iShares Core S&P Total U.S. Stock Market ETF (ITOT)
As you might have expected, the all stock portfolio has the highest average return and highest ‘best’ 10yr return using data going back to 1970. It also has the lowest ‘worst’ 10yr return. This widerange of returns illustrates the volatility that comes with all-stock investing.
The more balanced approaches predictably produce a more balanced range of returns. Notably, the Golden Butterfly portfolio provides the second-best average return and the highest ‘worst’ 10yr return. Indeed, the Golden Butterfly’s worst 10yr return was positive 4.1% annualized!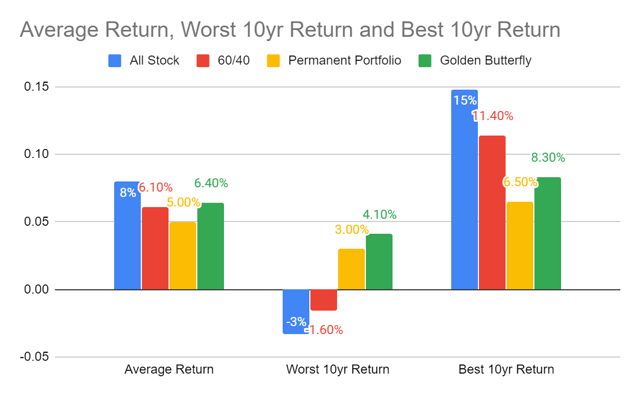
Source: DumbWealth.com, PortfolioCharts
Expanding beyond the worst/best 10yr returns, the charts below show the rolling 10yr forward returns for each of the portfolios going back to 1970. Notice that both the Permanent and Golden Butterfly Portfolios never experienced a negative 10yr period.
Total Stock Market Rolling 10yr Returns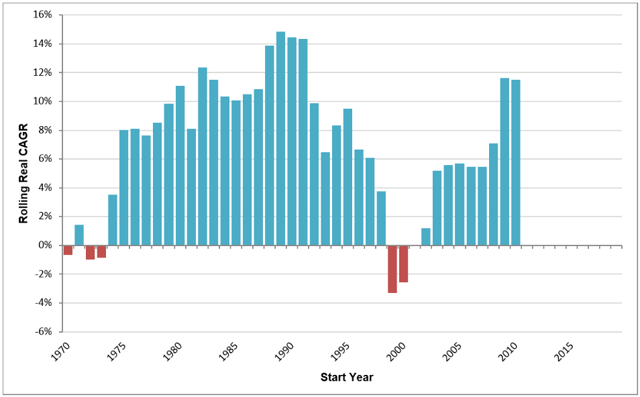
Source: PortfolioCharts
60/40 Portfolio Rolling 10yr Returns
Source: PortfolioCharts
Permanent Portfolio Rolling 10yr Returns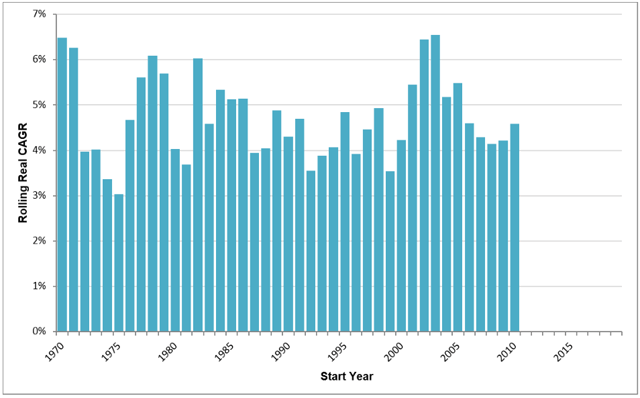
Source: PortfolioCharts
Golden Butterfly Rolling 10yr Returns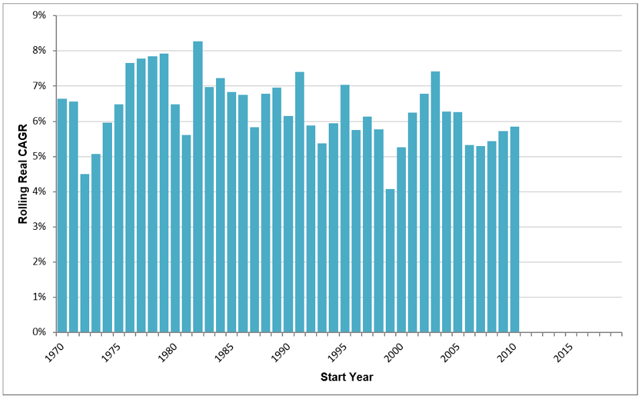
Source: PortfolioCharts
Despite what some people say, investing isn’t about maximizing returns. Investing is about aligning risk/return parameters to an individual investor’s preferences.
Investors aren’t robots and they experience extreme emotions when portfolios fall in value. After all, the money they have invested is representative of all the income they earned through their life doing something they’d probably rather not be doing. It is representative of the time, stress and emotional and physical energy expended throughout their lives.
So while a spreadsheet might tell you to choose the portfolio with the highest long-term average return, the human factor complicates things. People don’t like losing money, despite what they might indicate on their investment policy statements. When markets start declining, people freak out.
Below, I examine the downside to each of the portfolios.
The first chart shows the frequency of negative returns and the maximum depth of peak-to-trough drawdowns. The All Stock Portfolio had the most frequent negative years (28%) and deepest drawdowns (49%). In contrast, the Golden Butterfly Portfolio was negative only 18% of the time and had a maximum drawdown of only 11%. This is a huge difference.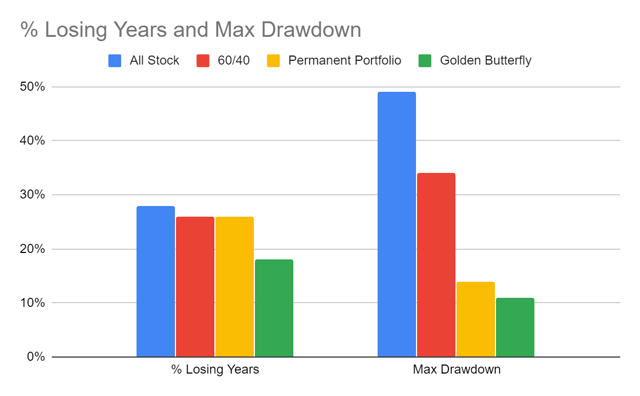
Source: DumbWealth.com, PortfolioCharts
Most drawdowns don’t recover quickly. The deeper the drawdown the longer the recovery. Specifically, the All Stock Portfolio experienced the longest time to recovery (13 years). The Golden Butterfly Portfolio experienced the shortest recovery period of only 2 years.
While the fear of missing out (aka FOMO) can take over during aggressive bull markets, over the long haul I believe investors are more likely to stick to their plans if they experience fewer and shallower portfolio declines. For many investors, the 160bps lower average return (Total Stock Portfolio vs Golden Butterfly Portfolio) is a suitable tradeoff for less downside.
Source: DumbWealth.com, PortfolioCharts
Interest rates can’t go much lower. Post Covid-19 de-globalization, supply shortfalls and nearly infinite central bank easing could create inflation. It is entirely plausible that the investing environment evolves into something most investors have never seen.
Standard 60/40 asset allocations – mainstays of the past 40 years – might breakdown if the world enters a new investing era and markets are impacted by a changing set of variables.
I believe now is the time to start testing alternative portfolio allocations – such as the Golden Butterfly Portfolio – that incorporate assets that could protect and provide during an economic regime more resembling the 1970s than the 1990s.
This article was written by
Disclosure: I/we have no positions in any stocks mentioned, and no plans to initiate any positions within the next 72 hours. I wrote this article myself, and it expresses my own opinions. I am not receiving compensation for it (other than from Seeking Alpha). I have no business relationship with any company whose stock is mentioned in this article.
Additional disclosure: This is not advice. Please contact a registered investment professional to discuss your personal financial circumstances. While every effort was made to ensure accuracy, the information in this article contains no warranties with regards to accuracy.

