Introduction
With the bull market in its eighth year, it has become increasingly difficult finding stocks which present a fair value opportunity for investors. This is especially a problem in the dividend growth realm, as investors have bid many dividend paying stocks up due to historically low interest rates. One of the most stable industries in one of the most stable sectors is the food industry. Recently, several big food companies have appeared on my stock screeners and on Custom Stock Alerts due to their recently falling stock prices and proximity to their 52-week lows.
I want to take a deeper dive into Kellogg’s (NYSE:K), General Mills (GIS), Hormel (HRL) and J.M. Smucker (SJM). This is going to be a four part series. This is so I have additional runway to dive deeper into each company than trying to cram four small “analyses” together. By the end of each article, I hope to have a clearer picture on whether each company:
Brands
A portfolio of recognizable brands separates these companies from generic products on a shelf. It’s crucial for the players in this space to develop brand trust over time and buy up and coming brands strategically to stay ahead of competition.
Kellogg’s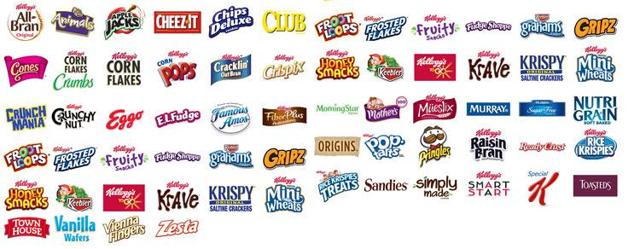
To lead off with, Kellogg’s has an enormous stable of brands, included but not limited to; Eggo, Special K, Cheez-It, Pringles, Keebler, Rice Krispies and Pop-Tarts. Many of these brands also offer healthy options as a segment of consumers like to have nutritious choices to eat.
Brand acquisition is an important part of the company’s growth story. In just this millennium, they have acquired Keebler, Kashi and Pringles. You’ll note that the recent acquisitions they’ve made have been international food players. Later in the article, I will highlight that Kellogg sees emerging markets being one of the biggest growth opportunities ahead.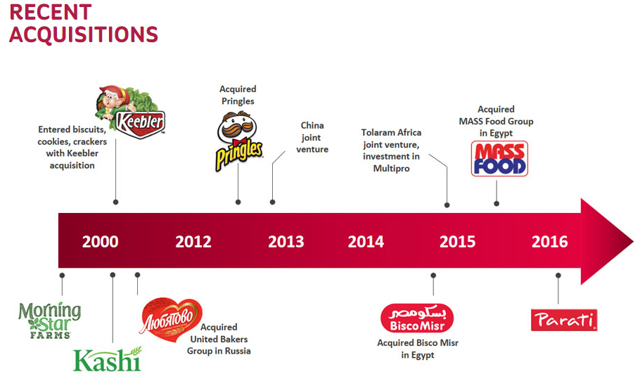
Historical Performance
It takes a long time horizon to see wealth compounding. A successful investment and ones that beat the market average require consistent earnings growth.
As part of my analysis, I love using Fast Graphs. A picture is truly worth a thousand words, though I’ll try to keep it shorter than that.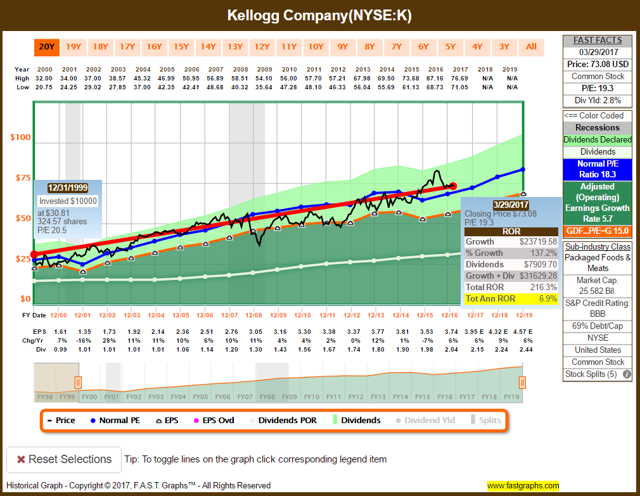
Kellogg has had stellar performance over the past twenty years. Don’t expect enormous growth but only two years (2001 and 2015) saw negative earnings growth. For the reference period, Kellogg had a 6.9% CAGR while the S&P returned 3.8% annually during that same time period.
When looking at the price movement over the period, there are several periods that jump out, namely the recession and some periods since then when the stock price traded at a multiple that was a historical discount to how investors typically value Kellogg. Astute investors would be sitting on nice gains for purchasing at those price points due to experiencing multiple expansion along with steady earnings and dividend growth. Currently, the stock is trading much closer to its historical multiple after the price got way ahead of itself during 2016.
The company has an average credit rating, S&P rates them as BBB and is a dividend contender with a 12-year raise history.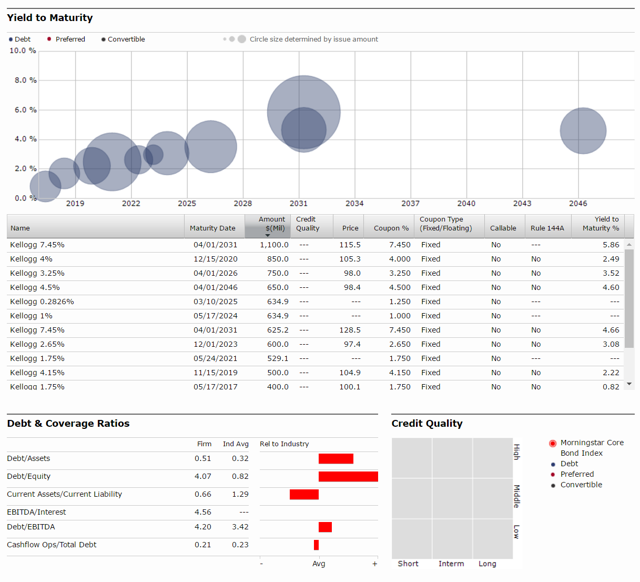
This is the debt situation per Morningstar. The company is rather leveraged right now which explains their credit rating not being that stellar. They have actually been become more leveraged over time so these metrics have not been improving. There are a lot of bonds coming due in the next few years that the company is working on reissuing.
Here is one such recent issuance, in February 2016, of $1.4B. As highlighted in the Moody’s release, the proceeds will primarily be used to retire the 7.45% notes due 2031. The notes issued are 4.5% fixed notes that you can see all the way on the right-hand side on the debt screen. Those will be coming due in 2046. Most of the soon to be coming due debt are low coupons, there are just two separate 7.45% notes totaling $1.725B due in 2031.
In Lowell Miller’s book, The Single Best Investment: Creating Wealth with Dividend Growth, he highlights credit rating being of the most important parts of an investment thesis. His recommendation is BBB+ or better from S&P. On that front, Kellogg would fail here.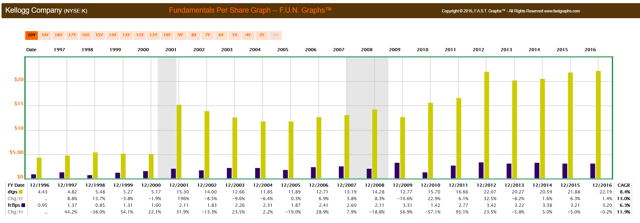
Looking at a FUN graph of the situation (nothing fun going on here), you can visually see debt per share (yellow) growing in proportion compared to free cash flow per share (purple).
I will note that I am using adjusted earnings on Fast Graphs; many other places, including Simply Safe Dividends, uses GAAP earnings. On a GAAP basis, the stock is at 37x 2016 earnings. Kellogg reported a loss in Q4 2016 and for the year had substantial restructuring costs for their Venezuela subsidiary.
Other than that, the stock scores incredibly high in safety with a better than average current yield. Recent dividend growth has been relatively small, in line roughly with earnings growth. Part of the high safety scores comes from their selling a biologically required item, which makes food companies some of the most stable and dependable investments in the market.
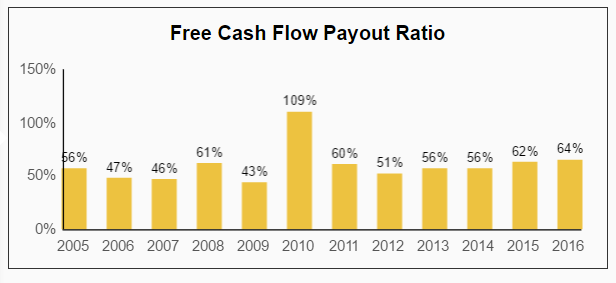
To a dividend growth investor, the free cash flow payout ratio is one of the most important pieces of information to study and analyze. As dividends are paid in cash, this graph shows just how much of free cash ((cash from operations + cash from financing) – capex) is being taken out of the business to pay investors. The ratio has ticked up slightly in recent years, but the dividend is very much still well covered. Just don’t expect massive growth, expect increases to be in line with earnings growth.
Flipping back to look at the FUN Graph, I like to watch cash as it moves in and out of the business over time. As the income statement can be adjusted, cash moving in and out is much harder to fake.
From the graph, these are all “per share” metrics:
Tallest blue line – Operating Cash Flow
Light purple – Capital expenditures
Dark purple – Free Cash Flow
Green line – Dividends Paid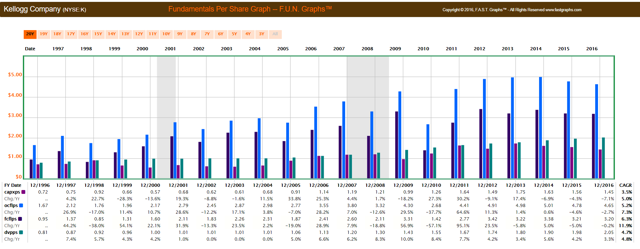
Ok – so what am I trying to show? The dividends paid (the green line) is well below the free cash flow (the dark purple line) and has been so except for 2010. Since these are per share metrics, you can visualize growth as you see the blue and dark purple lines grow over time. From my comments earlier regarding how free cash flow is calculated, in the image you can subtract the light purple (CAPEX) from the tall blue (operating cash flow) to come to the purple (free cash flow) line.
In aggregate, over the past 20 years, free cash flow has grown by 6.3% annually with dividend growth of 4.7%. In some of the earlier years, you can see the dividends paid took up almost all of free cash flow, so over time, free cash flow has outgrown the dividend, though in the past few years, that trend has reversed. That is visible in the free cash flow payout graph from 2011 onwards.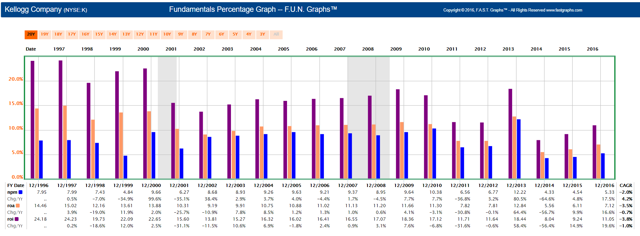
Another angle is to see how well management has been able to generate returns using everything at their disposal. This graph shows Returns on Assets (peach), Return on Investment (purple) and Net Profit Margins (blue).
All the metrics seemed to bottom in 2014 and have since recovered but not to the returns seen in past years. Net profit was a little over 5% at year-end 2016. That is still one of the lowest values seen in the last 20 years.
Because debt is an asset and I’ve called out debt as one negative factor to consider, I want to see strong return on assets. Kellogg saw 7.12% ROA in 2016, but I would like to see it improve over 10% as in many years past.
Looking Forward
The company has a 2020 growth plan that has several opportunities laid out on how they will grow going forward. (Source)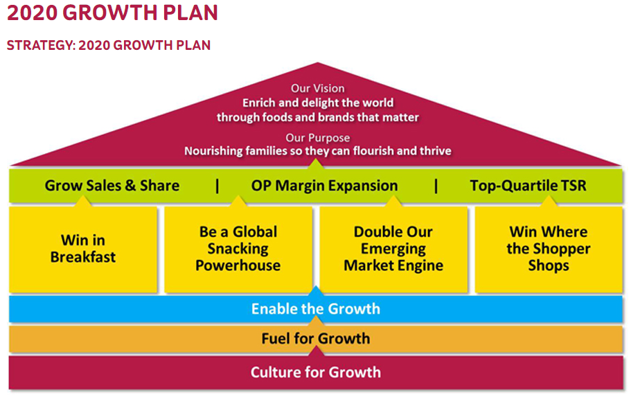
Extensive notes are listed on the linked page above, but here are a few pertinent notes regarding each of the four pillars (in yellow).
Win in Breakfast
45% of Kellogg’s global sales are from breakfast; they recognize changing consumer taste in breakfast and are focusing on their four largest cereal markets, the US, Canada, UK and Australia.
Big area of growth exists in emerging markets, $1 in revenue with 6.5% growth in 2015. They expect revenue in these markets to double by 2020.
Expanding cereal consumption out of breakfast is another area the companies sees large growth opportunities. They posit that the benefits of eating cereal at breakfast – it’s healthy, tasty, light and convenient – are more compelling when compared to other foods that are considered snacks. 30% of cereal in the US is eaten as a snack while that figure is lower in the other 3 target markets listed above. The idea here is to drive cereal consumption in all other markets to the level attained here in the US. Drivers to help reaching those goals include more convenient cup and on-the-go packaging.
Be a Global Snacks Powerhouse
Snacks are the other driver of the company, generating nearly 50% of total sales. One example of how they are driving growth is with the Pringles business, which they highlight as the largest brand they own today.
Selling wholesome snacks is another area they are targeting to be more on trend with consumer tastes. They are looking for more snacks containing ingredients such as granola, fruits and nuts.
The last note for this section is trying to accelerate growth in the cookies and crackers business. Cheez-It is being pushed particularly hard and Kellogg is looking to expand the on-the-go snack offerings for the entire cracker portfolio.
Double Our Emerging Market Engine
80% of company sales come from a mere 20% of the total global population and this is viewed as an enormous, untapped opportunity. They are seeking to triple business in Arabia while doubling in Russia. Strategic, regional acquisitions will help accomplish this goal by providing manufacturing capabilities, talent and established infrastructure to jump start these initiatives. From there, they can produce their classic products leveraging these acquired assets.
In Asia, Kellogg saw double-digit growth over the past year which they expect to continue. A billion potential consumers in Africa is another area the company hopes to develop over the next decade. In September 2016, the company bought a 50% stake in Multipro, a premier sales and distribution company in Nigeria and Ghana.
Win Where the Shopper Shops
This section doesn’t have many hard facts to point to, but they highlight that being wherever a consumer is, is important to growing their sales. They highlight the fact that grocery stores have long been their strong suit, but they understand they need to continue growing and investing in their e-commerce sales.
Build a $1B Next-Generation Natural Business
This section is not listed in the pyramid above, but it is specifically spelled out in the growth plan notes.
Another next step the company highlights is their desire to have what they are calling a next-generation natural (NGN) business. In layman’s term, they want to have more natural food offerings, mostly through leveraging their Kashi brand domestically, but also by using regional assets such as their “Be Natural” brand that is in Australia.
They see it being a $1B opportunity by 2020. Kellogg desires to be on the forefront of changing consumer tastes by catering to these “Food Forwards”. They suggest this group roughly makes up 30% of the adult population. Generally speaking, these are well-informed, highly engaged and active in the digital space people who demand full transparency about the sourcing of the foods they eat.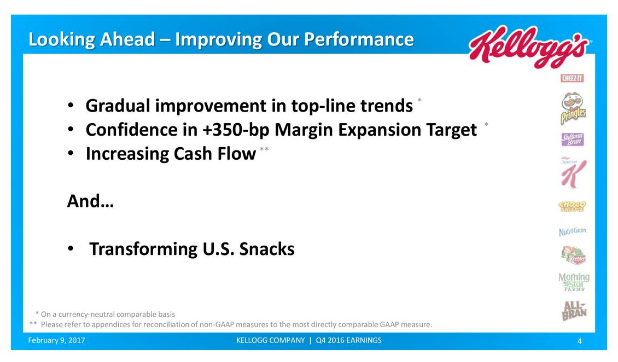
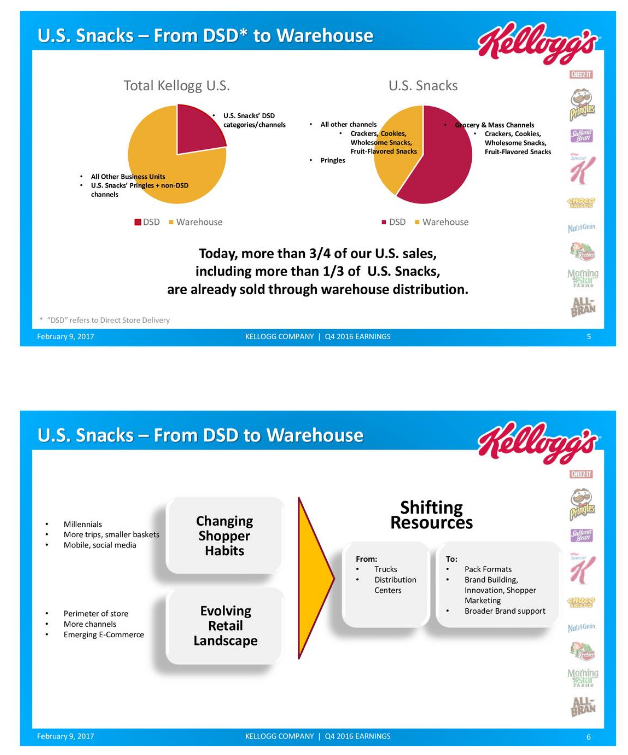
(Source Q4 investor presentation)
Kellogg is looking on a few fronts for increased profitability going forward. Management has expressed confidence in their ability to expand margins (always good) which would ultimately come down to the bottom line in increased cash flow.
More importantly, the company is shifting from DSD (Direct Store Delivery) to warehousing. The aim is to become more omni-channel as the rise of e-commerce has changed how their products can be sold. This will shift resources from trucks and distribution centers to generating a broader brand campaign where consumers can get their products.
They expect in the near term there will be costs and temporary volume disruptions associated with this migration, but they expect in the long term to see overhead savings and to provide better scale and service.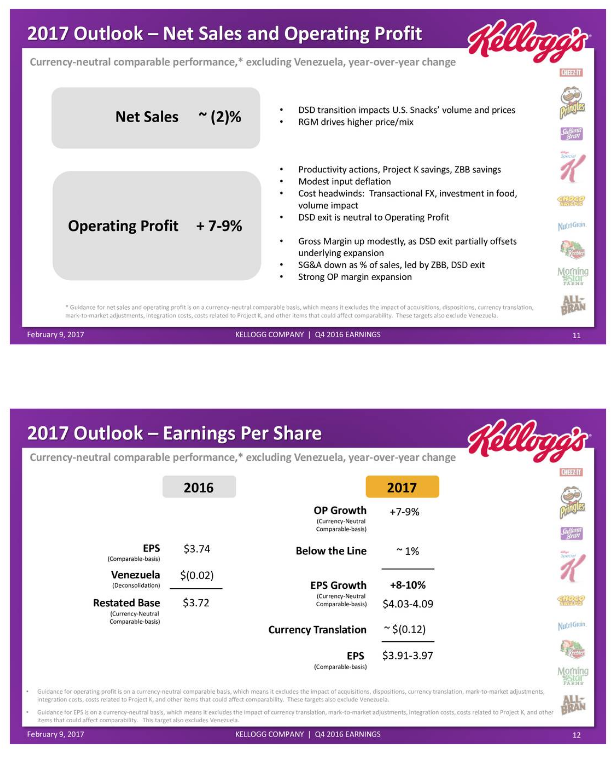
The goals for the year actually include an expected decline of 2% for sales. As previously mentioned, the transition from DSD to warehousing will drive this.
On the plus side, they are guiding for 7-9% increased profitability, driven by cost savings, input deflation, increased gross margins and lower SG&A costs.
With all of that netted, the company is guiding for an estimated earnings of $3.95 for 2017. That would be a 6% increase of the $3.72 earned in 2016. At a stock price approximately $72.50, this would put the company at a forward P/E of 18.3. Not a bad deal both historically speaking as well as in this current market environment. It remains to be seen if they hit these goals, they seem rather lofty given they are guiding for a sales decline.
Conclusion
When I look at the picture as a whole, I see a steady business with a large moat and global footprint. I am encouraged by the industry in which they operate and the repeat nature of sales, everyone certainly needs to eat.
From my introduction, I wished to solve two questions, is the company investment worthy and whether it is worth investing in right now.
On the first front, yes, I do believe Kellogg is certainly investment worthy. The company has a powerhouse of brands under their control that they have successfully been able to leverage for decades. While there may be near-term headwinds like changing consumer purchasing habits and currency effects, there are long-term drivers like the overall untapped population they are able to sell products to. Kellogg has been making moves in that direction through acquiring regional players in emerging markets.
The company does have a high level of debt per share and it is a story to keep watching, but as long as they are able to continue generating profits greater than the interest on said debt, they will do fine.
On the second front, is the company worth buying now? With the stock very near a 52-week low and trading at historical P/E multiples, now would not be the worst time to buy. I would hardly call the company a steal at these prices, but in an overall expensive market, you could overpay for a lot of other names. With that said, it seems like a hold for now.
I developed and run Custom Stock Alerts, so I will say you should check it out and at least give it a try.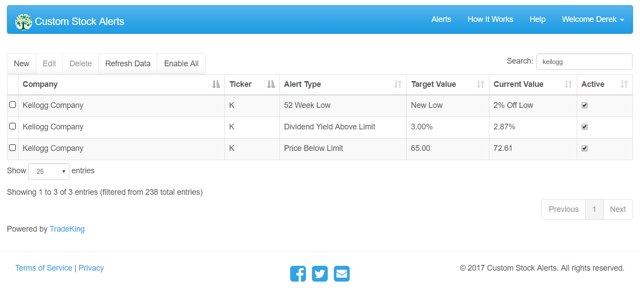
I’ve included a snapshot of some alerts I have setup for Kellogg.
I would be much more interested in Kellogg if the price decline continued. I put in a target value of $65, that would roughly be 16.5x 2017 expected earnings of $3.95. If the stock were to hit that along with the company meeting their expected earnings growth, that would be a decent discount to their historical premium.
Another of Lowell Miller’s rules for dividend investing is to pick a stock with a current high yield, 150% of the S&P yield (or better). The S&P is currently yielding about 1.95%. A target dividend yield would be 2.92% or better. Kellogg is close to that market, but if they were to hit roughly my price target that would roughly create a 3.2% yield before considering a dividend increase that is expected to begin with the August/September payout. In any event, Kellogg may be worth revisiting around that time frame to see what the increase may be.
I hope you enjoyed the article and please leave me feedback. If you found this value, I will encourage you to follow me. I’ll be working on the other parts of the series in the coming weeks.
This article was written by
Disclosure: I/we have no positions in any stocks mentioned, and no plans to initiate any positions within the next 72 hours. I wrote this article myself, and it expresses my own opinions. I am not receiving compensation for it (other than from Seeking Alpha). I have no business relationship with any company whose stock is mentioned in this article.

