A number of subscribers to my “Adaptive Momentum Investing” marketplace service have asked me for a portfolio that requires less monitoring and trading. To meet their needs, I constructed a new portfolio that invest in a subset of stable, dividend-paying stocks. I selected the current list of the dividend aristocrats as the asset universe and applied my adaptive momentum strategy. The results are very promising and are presented in this article.
Information about the dividend aristocrats list is widely available on the web. Here are two links.
The second link is the source from where I downloaded the excel spreadsheet:
dividend_aristocrats.xlsx
The adaptive momentum strategy I used for this portfolio was described in my previously published articles on this site. Here is a link to my latest article:
During market risk-on periods, all the funds are invested in a number of stocks with the highest total return over the “performance evaluation period”. During risk-off periods, all the funds are invested in the top 2 Treasury Bond ETFs from this list: IEI, IEF, TLT.
The allocation of the funds is rebalanced periodically: weekly, monthly or quarterly. We show simulation results only for monthly and quarterly rebalancing.
The number of assets invested during risk-on periods is an important parameter of the strategy. We experimented with all the numbers from one to six, but we show only the results for two, four and six stocks.
We performed back testing for a period starting on January 1, 2008, and ending on September 14, 2021. The summary of the performance is shown in two tables. The first table shows the performance over the whole interval, 2008-2021. The second table shows the performance over the most recent period, 2014-2021.
Portfolio 2008-21
Final Balance
CAGR
StDev
medianDD
meanDD
maxDD
Sharpe Ratio
Sortino Ratio
SPY
$4,055
10.77%
20.20%
-3.06%
-5.38%
-51.75%
0.48
0.68
Monthly Top 2
$15,534
22.20%
22.18%
-3.74%
-4.99%
-26.18%
0.95
1.30
Quarterly Top 2
$15,502
22.18%
22.30%
-4.08%
-5.62%
-32.50%
0.94
1.32
Quarterly Top 4
$10,416
18.68%
20.31%
-3.89%
-5.47%
-34.80%
0.87
1.16
Quarterly Top 6
$8,044
16.46%
19.45%
-4.02%
-5.66%
-38.48%
0.80
1.73
Portfolio 2014-21
Final Balance
CAGR
StDev
medianDD
meanDD
maxDD
Sharpe Ratio
Sortino Ratio
SPY
$2,117
14.42%
16.87%
-1.77%
-3.57%
-33.72%
0.80
1.18
Monthly Top 2
$5,673
25.33%
18.75%
-3.12%
-4.01%
-17.57%
1.30
1.89
Quarterly Top 2
$6,360
27.21%
18.79%
-2.87%
-3.66%
-15.24%
1.40
2.03
Quarterly Top 4
$4,348
21.07%
16.29%
-3.43%
-4.07%
-16.72%
1.24
1.71
Quarterly Top 6
$4,242
20.68%
15.42%
-2.90%
-3.76%
-16.59%
1.29
1.73
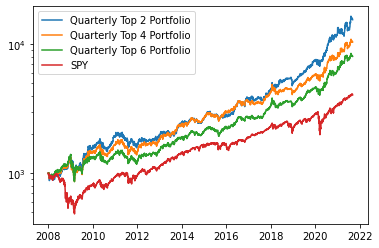
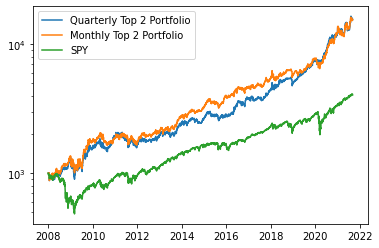
We also show two charts with the equity balance of the portfolios.
Figure 1. Performance comparison of quarterly rebalanced portfolios investing in the top 2, 4, 6 stocks.
Figure 2. Comparison between monthly and quarterly rebalance.
Over the whole simulation interval from 2008 to 2021, monthly and quarterly rebalancing produced very similar results, but in the more recent interval from 2014 to 2021, and more so since 2019, quarterly rebalance produced substantially better results. Although not shown, weekly rebalance would produce weaker results.
Currently, the evaluation period is 81 trading days. All three conditions, (1) total return of DBB vs. UUP, (2) total return of XLY vs. XLP, and (3) total return of SPY vs. 5% are pointing to risk-on conclusion.
Top four stocks ranked by 81-day momentum are: ALB, WST, SPGI, NEE

ADAPTIVE MOMENTUM INVESTING
Apply the results of our research to achieve superior returns while keeping losses manageable during severe market corrections.
Get access to our four portfolios:
Sign up for a FREE TRIAL today
This article was written by
Disclosure: I/we have no stock, option or similar derivative position in any of the companies mentioned, and no plans to initiate any such positions within the next 72 hours. I wrote this article myself, and it expresses my own opinions. I am not receiving compensation for it (other than from Seeking Alpha). I have no business relationship with any company whose stock is mentioned in this article.

