Microsoft (NASDAQ:MSFT) has fallen since reporting results, but the declines may only be starting. The drop came despite posting powerful fiscal fourth quarter results. Still, revenue guidance only came in line, and that simply isn’t good enough for a stock that is trading at such a lofty valuation.
The results have caused options traders to start circling, and it appears they are making bets the stock continues to its decline. Meanwhile, the shares are very close to breaking a very significant technical level.
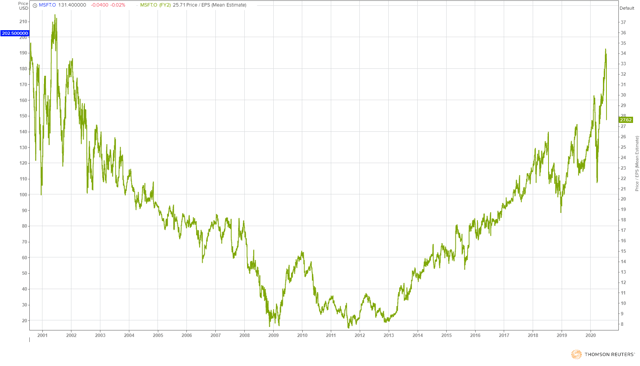
The stock’s valuation had soared to levels not seen in nearly 20 years before reporting results, trading at almost 35 times its one-year forward earnings estimates. That has fallen some since, to roughly 27.6 – which is still very high. While it makes sense as to why investors have flocked to Microsoft for its safety and balance sheet strength, it doesn’t mean that its valuation hasn’t become stretched.
The problem is that the company gave guidance that was in line to slightly lighter than expected. Analysts had been looking for fiscal first quarter revenue of $35.9 billion. But the company guided the quarter to a range of $35.15 billion to $36.05 billion, resulting in the mid-point of the range falling below expectations.
The slightly weaker guidance was due to a big miss in its Productivity and Business Processes. The company called for a range of $11.65 billion to $11.9 billion versus expectations for $12.1 billion.
(Refinitiv)
The inline/to slightly weaker outlook likely gave investors the warning they needed, which was that expectations had gotten too high on the stock, and the company was unable to meet them.
That is likely why now some traders are betting that the stock falls in the weeks ahead. For example, the open interest for the August 21, $220 calls increased by roughly 7,800 contracts on July 24. It sounds like a bullish trade, but digging into the data, we see these calls were traded on the bid, a sign they were sold. It is likely part of a covered call strategy, were an owner of the stock is looking to enhance their returns, while betting the stock does not increase beyond $220 by the expiration date.
Additionally, the September 18, $175 puts rose by approximately 6,200 contracts. The data showed these contracts traded on the ASK and were bought for around $2.10 per contract. It is a bet that the stock falls below $173 by the middle of September, a drop of roughly 14%.
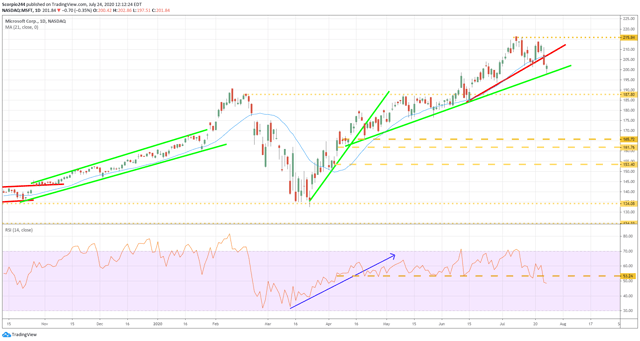
But what may be more important is that Microsoft is very close to falling below a significant level of support. The technical chart shows that a bearish pattern formed in Microsoft known as a bump and run. The stock already broke the high uptrend in the pattern and is now very close to breaking the lower uptrend. Should that trend line at $197 break, it is likely to result in the stock falling back to around $187.
We can also see that momentum in the stock is waning, the relative strength index has been gradually falling and is now at its lowest point since April. It would suggest that bearish momentum is taking over.
There is nothing wrong with Microsoft’s earnings or stock, just that the valuation had gotten ahead of itself. The results were much better than expected and guidance was basically in line. But when investors are paying a high multiple for an equity, expectations are for guidance that is much better than consensus.
The most significant risk based on the analysis is that markets continue to track higher, and should that happen, Microsoft is likely to rally with it. Just because an equity is overvalued today, doesn’t mean it can’t be more overvalued tomorrow. There is no telling as to how long investors will be willing to pay up for high-quality equities.
If valuations do begin to matter again to investors, then the stock is likely heading lower for a period.
Love this article? Then hit the follow button at the top of the story!
Live Webinar on July 30- Sign up now to participate! 9PM ET
Figuring the next big move in the market is never easy, so let it help you determine what that move will be. Every day, Reading The Market uses changes in fundamentals, technicals, and options markets to determine the next significant move in stocks, sectors, and indexes.
To Find Out More Visit Our Home Page
This article was written by
I am Michael Kramer, the founder of Mott Capital Management and creator of Reading The Markets, an SA Marketplace service. I focus on macro themes and trends, look for long-term thematic growth investments, and use options data to find unusual activity.
I use my over 25 years of experience as a buy-side trader, analyst, and portfolio manager, to explain the twists and turns of the stock market and where it may be heading next. Additionally, I use data from top vendors to formulate my analysis, including sell-side analyst estimates and research, newsfeeds, in-depth options data, and gamma levels.
Disclosure: I am/we are long MSFT. I wrote this article myself, and it expresses my own opinions. I am not receiving compensation for it (other than from Seeking Alpha). I have no business relationship with any company whose stock is mentioned in this article.
Additional disclosure: Mott Capital Management, LLC is a registered investment adviser. Information presented is for educational purposes only and does not intend to make an offer or solicitation for the sale or purchase of any specific securities, investments, or investment strategies. Investments involve risk and, unless otherwise stated, are not guaranteed. Be sure to first consult with a qualified financial adviser and/or tax professional before implementing any strategy discussed herein. Upon request, the advisor will provide a list of all recommendations made during the past twelve months. Past performance is not indicative of future results.

