This article was amended on 12/22 to reflect the correct Shiller PE 15-Year Chart.
If you invest the price of a Starbucks coffee into the S&P 500 (NYSEARCA:SPY) each day, in 50 years, you’ll be a millionaire.
Sound familiar?
The dangerous use of long-term averages extrapolated decades into the future has become practical advice for investors new and old. The Warren Buffett and Charlie Munger school of “buy and hold forever” is without question the most common form of investing advice (even though Mr. Buffett and Mr. Munger frequently sell stocks).
The most deceptive part of the advice cloaked with the seal of approval coming from the legendary tag team is the sequence of returns that came during the heyday of their investing career.
Mr. Buffett was born in 1930. By most accounts, Buffett was investing in the market before the age of 15. By 1945, dodging the worst 20-year period in modern American history, Buffett started his storied career as an investment manager.
As we’ll outline below, using 140 years of stock market history, we know the long-term average return rate for the S&P 500 is roughly 9.0%. However, this average is deceptive when your timeframe is anything shorter than 20 years, which encompasses a majority of investors with a retirement plan or already in retirement when investment returns take a back seat to the preservation of capital.
In 1945, the Shiller PE ratio was 12, which will become an important data point later in this article. From 1945 through the summer of 2020, the S&P 500 compounded at 11.2%, well beyond the long-term average of 9.0% established since 1880.
This note will outline the true buy and hold data, both the range of outcomes and the “average outcome.” We will also look at the most researched valuation measure with clear predictive power regarding future returns, the Shiller PE ratio. Using these two factors, a long-term history and a researched valuation measure, augmented with long-term economic trends, we can highlight why the “buy and hold” strategy is likely to let you down.
By “let you down” or “fail,” I am not suggesting the stock market will crash and you will lose 50% of your capital like many sensationalized stories that seek eyeballs over practical analysis. With a 10-20 year holding period, a buy and hold strategy is likely to “fail” by falling short of the “average” return assumption that many investors have been lulled into using.
Pasting 9.0% into your retirement spreadsheet, or sadly even higher in some investment plans, is bound to fail nearly half the time if you picked a random starting date. With information about starting valuations and the predictability of the Shiller PE, imperfect as it is, the scales are tilted massively in favor of a long-term return that is significantly below the long-term “average” we have been trained to use.
When investors hear that stocks deliver 9.0% on average, the human mind is programmed to think that returns come predictably, 9.0% year in and year out. What investors come to realize, quickly in some cases and slowly in others, is that a long-term average of 9.0% actually comes in the form of +30% one year, -20% another year, and a bunch of slightly positive returns years sprinkled along the way.
Creating a return stream that is much more stable or an investment plan that has a much more narrow range of outcomes is more desirable for many investors, particularly those that are in retirement or within 20 years of retirement, as stability trumps return. Many investment programs cannot or should not accept a 50% loss of capital as the cost of doing business when looking to generate high returns on capital.
Below we’ll analyze how and why you should use long-term valuation measures to augment the return stream created by an allocation to SPY in your portfolio.
We will be using the Shiller PE ratio, long-term S&P 500 total return data, and ETF (SPY) when the time series is shorter.
The Shiller PE ratio was popularized by Professor Robert Shiller of Yale and has gained widespread attention for the correlation or predictive power between the Shiller PE ratio and long-term stock returns.
To clarify, there has not been any analysis that suggests the Shiller PE has any relation to the performance of the stock market in the next several years, as much as five years. Still, there is substantial historical data to reference.
The Shiller PE is different than most valuation measures because the Shiller PE uses a 10-year trailing average of earnings per share “EPS,” adjusted for inflation. The logic for a 10-year average was that earnings could be too volatile in any given year due to recessions and other one-off risks. By creating a “real” or inflation-adjusted 10-year average, you have a stronger idea of the earnings per share you will receive.
Shiller PE Ratio: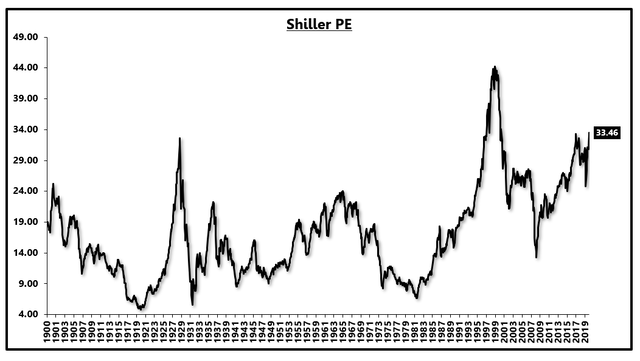
Source: Robert Shiller
The Shiller PE is also unique for the long historical sample, spanning different monetary policy regimes, periods of inflation, deflation, war-time, peace-time, and all the other changing yet repeating factors across 100 years of history.
Stepping away from the Shiller PE momentarily, we know, using historical data, that the S&P 500 has compounded at 9.0% per annum from 1880-2020, a 140 year time sample.
S&P 500 True Buy & Hold Data: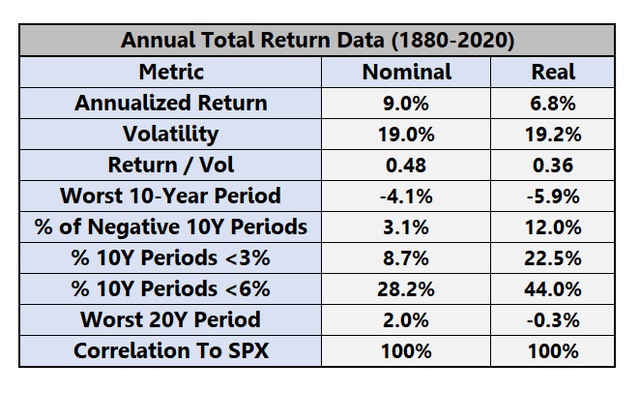
Source: Robert Shiller, Multipl
Over the last 140 years, stocks have delivered 9% returns with nearly 20% annualized volatility, a long-term return-to-risk ratio of 0.48.
The notion that a buy-and-hold investor will make gains over any 10-year period is flawed. The worst 10-year period for a buy-and-hold investor was -4% per year.
As noted in the chart, if you had a 6% return assumption for the S&P 500, your assumption failed 28.2% of the time.
As the length of your timeframe increases, such as 20-years noted in the chart, the range of your potential outcome converges to the long-term average, closer to 9.0%.
At the 10-year holding period mark, which encompasses the timeframe of most investors either in retirement or within 10-years of retirement, the range of outcomes for a buy-and-hold investor is far too large to make future plans.
Charted below is the rolling 10-year return for the S&P 500, in “real” or inflation-adjusted terms, over the last 120 years.
When you invest money into the stock market with a multi-year holding period, how can you be sure that your return will be better than the average?
As the chart highlights, there are numerous times when you invested your money into the stock market, and 10-years later had less money than when you started.
S&P 500 Rolling 10-Year “Real” Return: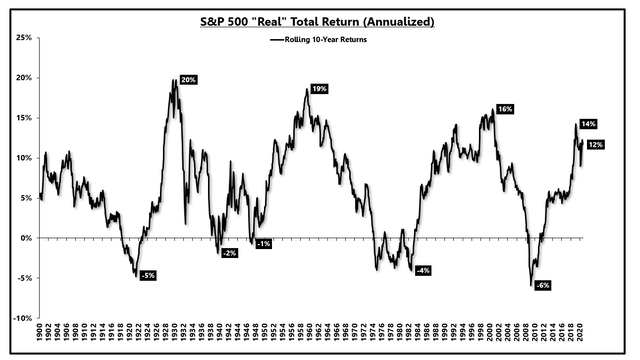
Source: Robert Shiller, Multipl
Using this historical data, you can make 20% compounded returns for 10-years by investing in the stock market, or you can lose 6% of your capital in real terms each year.
With a 26% range for a 10-year holding period, any investor that is in or near retirement must take measures to reduce the range of outcome, even if it means a slightly lower long-term average return.
A sound investment plan simply cannot go “all-in” on an investment with a 26% outcome range over a 10-year period.
At the 20-year holding period mark, the historical range shrinks from 26% to 14%.
Over 20 years, an investor never lost money in the stock market (in real terms) and made as much as 14% per year if investing from 1980-2000.
S&P 500 Rolling 20-Year “Real” Return:
Source: Robert Shiller, Multipl
The main takeaway is that even at the 20-year mark, it is more than possible for your returns to fall below the long-term average because, after all, it is just an average.
As the “true buy and hold” data table shows, the average return for the S&P 500, in real terms, has been 6.8%. A long-term average “real” return of 6.8% is better than virtually any other asset class. This is why any investment plan requires at least some exposure to the stock market. Concentrating your investment plan in the stock market, with a holding period of less than 20 years (mostly everyone), requires a fair bit of luck to be “better” than average.
While the long-term average for real stock market returns is 6.8%, an investor with a 10-year holding period failed or fell short of that average return more than 44% of the time.
This is why buy and hold can fail you. It requires luck and the sensitivity of your start date, or your starting valuation, as we will show below, is the single most important factor in determining if your 10-year or 20-year holding period will be better or worse than average.
So what do we know up until this point?
We know that the S&P 500 has generated about 9.0% nominal returns and 6.8% real returns on average since 1880. We also know that if you randomly picked a 10-year holding period, you would do better than average about half the time and worse than average about half the time. There is a great deal of luck in your starting period.
Using the Shiller PE ratio and 140 years of historical data, we can make a reasonable assumption about whether the next 10-years or 20-year will be better or worse than average.
How can we start to make a reasonable guess about whether our next 10-year or 20-years will be better than average?
On average, stocks generate a return-to-risk ratio of less than 0.5. This poor ratio is tolerated because stocks increase the expected return of a portfolio, on average. If the expectation changes in the direction that stocks will deliver worse than average returns, then the return-to-risk compensation falls even further.
Below, using a bucketed approach, we’ll see why more than 100-years of data tells us to expect worse than average.
The table below shows 12 buckets, corresponding to a range of Shiller PE ratios. For example, bucket 1 means the Shiller PE ratio is in the range of 4-9. In bucket 5, the Shiller PE ratio is in the range of 15-17.
The chart shows the average, best, and worst 10-year returns, in real terms, for buying the S&P 500 and holding it for 10-years, starting at different Shiller PE ratios.
To clarify, the chart below shows that if you bought the S&P 500 and held it for 10 years every time the Shiller PE ratio was in the range of 4-9 (bucket 1), your average return was 12.0% per year in real or inflation-adjusted terms. Your best 10-year period was 19.8% per annum in real terms, and your worst 10-year period was +1.8% per year in real terms.
Mapping this data for all buckets shows a clear relationship. Your average return across history was generally higher when you started at a lower PE ratio. Also, your best return was typically higher, and your worst return was generally lower.
10-Year Forward Returns Based On Starting Shiller PE:
Source: Robert Shiller, Multipl
Essentially, all the benefits of stocks (high returns) come when you start a long investing period with a low PE ratio, and all the negatives of stocks (massive drawdowns and volatility) come when you start a long investing cycle at a high PE ratio.
Circling back to Warren Buffett, starting a long investing cycle with a Shiller PE ratio of 12 (bucket 3), stacked the odds in his favor.
Today, the Shiller PE ratio is roughly 33, which places the S&P 500 in bucket 11. Historically, the next 10-years only generated 0.6% per year in real terms when you started a 10-year investment cycle with a Shiller PE in the 30’s.
Your best return, however, was still +4.4% per year in real terms, so if inflation averaged around 2.0%, the data still supports the possibility of 6% compounded returns.
The takeaway is not that the S&P 500 and its ETF counterparts (SPY) will crash by 50%, although the risk is heightened at higher valuations. The main point is that the odds of generating above-average returns in the S&P 500 are not in your favor when you start with a Shiller PE ratio of 33.
According to more than 100-years of history, a buy and hold approach will leave you well short of your long-term goals when starting at extremely high valuations.
A very similar pattern can be seen using the same methodology but a 15-year future holding period rather than 10-years. The relationship between lower starting PE ratios and better average returns is still obvious, although the range of outcomes has narrowed at the longer holding period.
15-Year Forward Returns Based On Starting Shiller PE: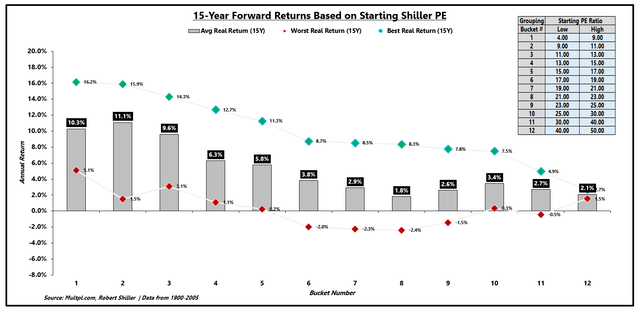
Source: Robert Shiller, Multipl
Due to various factors, including central bank influence, changing tax policy, and shifting corporate management practices such as share buybacks, we have become accustomed to this period of higher than normal valuations.
Over the 105 year period from 1900 through 2005, 92.2% of the time was spent in bucket 9 or lower, meaning that the Shiller PE ratio was less than 25 more than 90% of the time. Today, the exception is becoming the norm.
% of Observation By Shiller PE Bucket: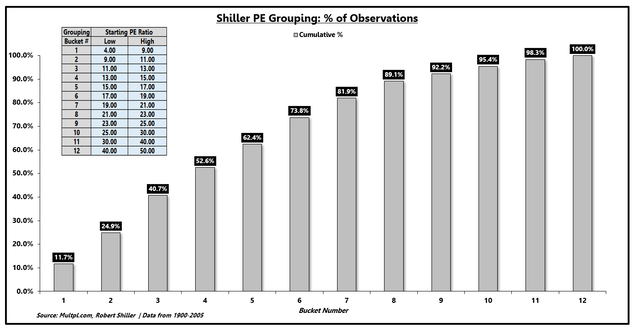 Source: Robert Shiller, Multipl
The common argument is that since interest rates are low, there is no alternative, and stock valuations must rise. To some extent, this is true.
The Shiller PE uses “real” or inflation-adjusted earnings. The inverse of the PE ratio is often called the “earnings yield,” so if the Shiller PE ratio is 33, then the inverse is 1/33 or 3.0%.
Many investors compare this “real” earnings yield of 3.0% with the real interest rates on risk-free Treasury bonds, currently about -1.0%.
This 4.0% “spread” is commonly called the “risk premium,” and given that today’s equity risk premium is about 4% and it was about 0% in 2000, then today’s valuation is not so extreme.
Earnings Yield Vs. Real Rate: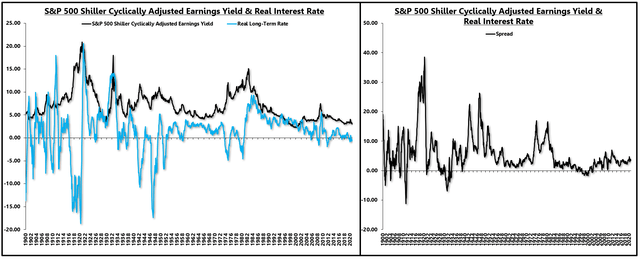
Source: Robert Shiller, Multipl
I understand but dislike the equity risk premium analysis. First, we are comparing a high-risk investment (equities) to a risk-free investment, so the fact that there is a premium for taking more risk shouldn’t be surprising.
Second, justification is selective. In the 1940s, real interest rates dropped lower than -10%, but the S&P 500 offered an earnings yield of more than 8%.
In the early 1980s, real interest rates dropped to -4%, but equities were out of favor, offering a 10% earnings yield.
Throughout history, we see periods of low and deeply negative real interest rates not associated with extreme valuations, so the interest rate argument is insufficient.
Lastly, the economy is not static. Economic risks vary over time, as do the initial conditions. When economic risks are high or growth prospects are grim, there should be an extra premium for added equity risk.
As a result, we cannot use the equity risk premium metric in insolation without considering the embedded economic risk.
An equity risk premium of 5% with economic growth of 4% is not the same as an equity risk premium of 5% with economic growth of 1%.
Below we will decompose the long-term earnings profile of the S&P 500 and use an economic growth approach as a support for the strong valuation analysis.
The Shiller “earnings” or “cyclically adjusted earnings” equate to the 10-year trailing average EPS for the S&P 500 adjusted for inflation.
We know that the “real” or inflation-adjusted return for the S&P 500 is about 6.8% over the long-run. Unsurprisingly, over the last 60-years, Shiller earnings have increased at 6.0% per year.
Shiller PE Earnings Growth:
Source: Robert Shiller, Multipl
Ultimately, the stock market will follow earnings with a wildly fluctuating yet mean-reverting PE ratio.
The best way to measure future stock market performance is to estimate future long-term earnings growth. Stocks are priced on a per-share basis, so an assumption for continued share repurchase programs is necessary.
We can decompose the real earnings per share metric into three components. Real GDP growth will be the foundation for the long-term average real earnings per share. Changes in the effective corporate tax rate will let more or less earnings fall to the bottom line. Share buybacks will reduce the share count and lead to higher EPS growth.
Due to an excessive debt overhang and worsening demographics, the real GDP growth rate has been declining in a nonlinear fashion. Charted below is the 20-year annualized rate of real GDP per capita. Real economic growth averaged nearly 3% for decades which, all else equal, would contribute to higher real earnings growth.
20-Year Annualized Growth In Real GDP Per Capita: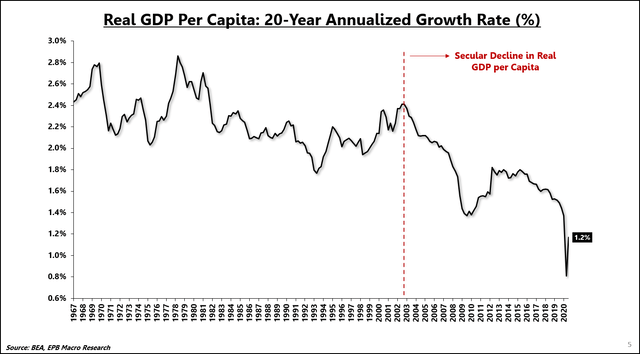
Source: BEA
Corporate management has been remarkable at generating consistent long-term EPS growth over the last 20 years, reliably staying in the 5%-6% real growth range.
As real economic growth started to decline from nearly 3% down to the low 1% range, corporate management had to make up 2% real EPS growth per year. The answer was two-fold. Increased share buybacks and lower tax rates.
S&P 500 companies consistently reduced the share count to help bridge the gap between 5%-6% real earnings growth and 2% real GDP growth.
Moreover, corporate America has paid ever-lower effective tax rates. Charted below is the amount of corporate taxes paid as a % of total corporate profits from the National Income and Product Accounts.
Effective Corporate Tax Rate: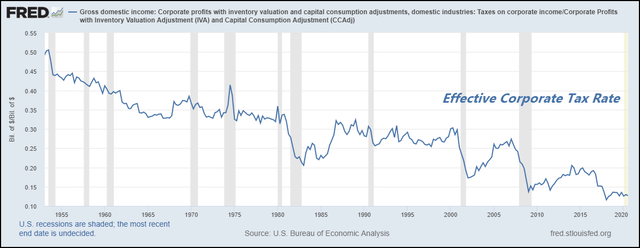
Source: FRED
In the last 20 years, in order to make up for falling economic growth, the effective corporate tax rate plunged from about 30% to roughly 12% today.
Corporate tax rates may continue to fall, but to see a repeat of the last 20 years is improbable.
Our business sector, which includes the corporate sector, has seen debt rise from 65% of GDP in the early 2000s to nearly 90% today, brushing up against the diminishing marginal returns threshold.
Total Business Debt to GDP: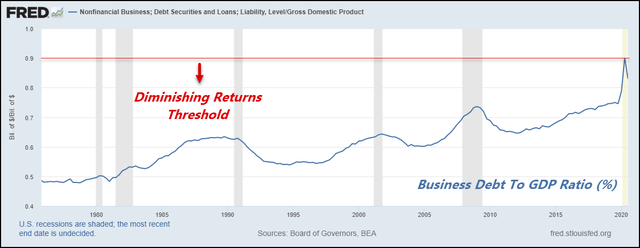
Source: FRED
Again, share buybacks may continue like tax rates may keep falling, but to assume a repeat of the last 20 years is a tall order.
As a result, our long-term earnings assumption comes from real economic growth of roughly 1.5%, slightly better than the per capita growth rate of the last 20 years. However, the evidence suggests this is an optimistic assumption.
Corporate management will have to bridge the gap between 1.5% real economic growth and 5%-6% real EPS growth with an effective tax rate already as low as 12% and, collectively, a highly indebted balance sheet.
The odds of the historic 5%-6% real EPS growth are more likely to fall into the range of 3%-4%, leading to future returns below the long-term average.
Over the past 20-years, the S&P 500 has compounded at 7.4%. Inflation averaged 2.0%, so the real total return was 5.4%. Real earnings compounded at 5.8% over those 20-years, but the total return was slightly lower as the multiple fell from 37 to 33, based on the Shiller PE.
Over the next 10-20 years, using the Shiller PE and 140 years of history stacks the odds towards long-term returns that fall well short of the long-term average.
The economic growth approach, baring a change in trend economic potential, paints a scenario that will make it hard for long-term real EPS growth to exceed 4%.
If we assume the multiple on EPS or the Shiller PE is unpredictable over the long-run but mean-reverting, the odds favor lower than average real EPS growth and a lower earnings multiple.
The evidence clearly favors the prudent investor changing their long-term real return assumption from the 6% range to the 3% range. This 50% reduction in return potential for the S&P 500 will push the return/volatility ratio well below 0.5, arguing that an investment in stocks is not receiving adequate compensation for the level of risk.
The alternative approach to holding a stock-heavy portfolio and hoping to land in one of the luckier 10-20 year holding periods is to have a balanced portfolio approach.
The merits of a balanced portfolio approach are for another article. Still, you can substantially reduce your range of outcomes by holding a portfolio blended with stocks, bonds, gold, commodities, and at times, cash.
When stock valuations are high, and the economic prospects for real earnings growth are low, other assets are likely to offer higher risk-adjusted returns than the S&P 500. If stocks, bonds, gold, and commodities all suffer a negative 10-year period, cash will be the winner.
Starting a long-term buy and hold stock program and counting on “average” returns to achieve your goal is likely to fall short of expectations.
The long-term real return potential for stocks needs to be reset to the range of 3%-4%, making the risk-adjusted return for stocks not friendly to a major overweight allocation.
To close, you’re likely better off having a balanced portfolio approach and using starting valuations and sensible economic assumptions to “overweight” or “underweight” your stock exposure.
100+ years of history tells us that now is the time to have a reduced allocation to stocks if you have a 10-20 year holding period.
EPB Macro Research provides a complete investment framework that translates the research on economic growth and long-term valuations into an actionable portfolio of ETFs.
If you’d like to learn a long-term investment framework based on these principles and gain access to our model portfolio, click the link below for a free trial.
Click this link to start your 14-day FREE TRIAL
This article was written by
Eric Basmajian is an economic cycle analyst and the Founder of EPB Macro Research, an economics-based research firm focusing on inflection points in economic growth and the impact on asset prices.
Prior to EPB Macro Research, Eric worked on the buy-side of the financial sector as an analyst at Panorama Partners, a quantitative hedge fund specializing in equity derivatives.
Eric holds a Bachelor’s degree in economics from New York University.
EPB Macro Research offers premium economic cycle research on Seeking Alpha.
Click Here To Learn More
Disclosure: I am/we are long SPY (UNDERWEIGHT ALLOCATION). I wrote this article myself, and it expresses my own opinions. I am not receiving compensation for it (other than from Seeking Alpha). I have no business relationship with any company whose stock is mentioned in this article.


