This retirement income portfolio seeks a relatively safe stream of growing dividends. The 3.73% yield is lower than my 4.0% target yield because:
The portfolio gained 20.73% in 2016 and 17.72% in 2017. The year-to-date gain through August 17, 2018, has been 4.53%.
My previous article on August 13 described the purchase of BlackRock (BLK) and Toyota (TM). It described plans to deploy cash from a recent IRA rollover.
Eaton Corporation PLC (NYSE:ETN) was added to the portfolio on August 15 at $79.15. Eaton’s website cleverly declares:
“We make what matters work.”
Eaton makes power work:
“Power is a fundamental part of our world. That’s why we’re dedicated to improving people’s lives and the environment with power management technologies that are more reliable, efficient and safe. Because that’s what really matters. And we’re here to make sure it works.”
Eaton tackles the “toughest challenges” in electrical, hydraulic, and mechanical power management for airplanes, hospitals, factories, data centers, automobiles, and the electrical grid.
I first studied Eaton after watching an interview with then Chief Executive Officer Sandy Cutler in January 2011. ETN had just boosted its dividend by 17%. I made several buys from August 2011 through October 2012 at prices ranging from $35.65 to $47.50. I sold shares of ETN from January through July 2013 at prices ranging from $55.73 to $68.65.
Eaton was formed in 1911 and moved to Cleveland, Ohio in 1915. In November 2012, Eaton acquired Cooper Industries, which was based in Ireland. Eaton moved its corporate headquarters to Dublin, with North America headquarters in Cleveland.
Cutler retired as CEO in May 2016 at the company’s mandatory CEO retirement age of 65, after 41 years with Eaton and almost 16 years as CEO.
Craig Arnold became chairman and CEO in June 2016. The transition was well-planned and executed. Arnold joined Eaton in 2000 and had been Eaton’s president and chief operating officer since September 2015. (Photo from Eaton website, left to right: CEO Craig Arnold; Revathi Advaithi, President and Chief Operating Officer, Electrical Sector; Uday Yadav, President and Chief Operating Officer, Industrial Sector; and Richard H. Fearon, Vice Chairman and Chief Financial and Planning Officer.)
The IRA rollover presented an opportunity to re-establish a position in Eaton. My August 6 article described the addition of Cummins (CMI) and Illinois Tool Works (ITW). Eaton had not sold off as much as CMI and ITW, but on August 15, I bought ETN at 11.9% off its recent 52 week high price of $89.85. The graph below shows that I missed a great opportunity to re-establish a position in January, 2016 around $47.00: (5-Year price chart from Seeking Alpha)
The 2012 Cooper Industries acquisition
Like many other industrial companies, Eaton has transformed itself through acquisitions and sales of businesses. Their M&A activity, coupled with the cyclical nature of the business, makes year-to-year comparisons difficult. Eaton’s acquisition of Cooper Industries in 2012 helped boost revenue from $13.7 billion in 2011 to $16.0 billion in 2012. This transformation is described in Eaton’s 2012 Annual Report.
Revenues
Revenue for 2017 was $20.404 billion. Annual revenue growth for the past 5 years has been 5.6%. This includes the 35.2% increase in 2012. Revenue growth for the past four years has been negative: -1.8%. Revenue for the trailing 12 months ending June 30 was $21.162 billion, a 3.5% increase over the 12 months ending December 31.
Pre-tax profit
As Eaton continues to re-shape its business, pre-tax profit growth has been more steady than revenue growth. Pre-tax profit for 2017 was $2.291 billion, a 7.7% increase over 2016. For the 5-year period of 2013-2017, pre-tax profit grew by 14.9%. Annual pre-tax profit growth was 5.9% for 2014-2017. Pre-tax profit for the trailing 12 months ending June 30 was $3.585 billion, a 56.5% increase over the 12 months ending December 31.
Earnings per share
The company’s transformation has shown an even greater impact on earnings per share. EPS for 2017 were $6.68, a 58.7% increase over 2016. The 5-year annual EPS growth has been 15.9%. The 4-year growth (2014-2017) has been even higher, at 16.8%. (These are the diluted EPS reported by Eaton.) Finviz indicates that Eaton’s EPS growth rate for the past 5 years (2013-2017) was 13.5% and a trailing 12-month EPS of $6.94. Eaton’s quarterly reports show a trailing 12-month diluted EPS of $7.06.
Price/earnings ratio
For simplicity and consistency, I use the Finviz trailing 12-month figures on my portfolio spreadsheet. Using the Finviz EPS number of $6.94, at the closing price of $81.00 on August 17, Eaton’s price/earnings ratio was 11.7. F.A.S.T. Graphs shows a “blended P/E” of 13.9 based on diluted (GAAP) earnings. Better Investing shows a 5-year average P/E of 14.9.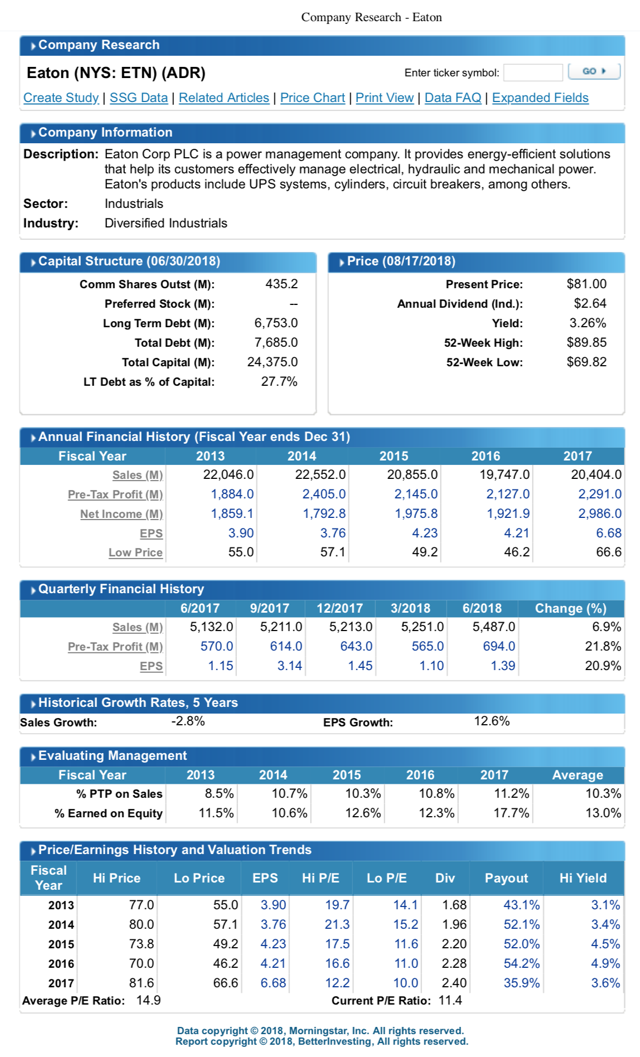 (Company Research from Better Investing)
Dividend
Eaton’s current dividend is $.66 per quarter, or $2.64 annually. With the March, 2018 payment, the dividend was raised 10%, from $.60 per quarter. ETN has raised the dividend for 9 consecutive years. The 5-year dividend growth rate has been 9.6%. At a current yield of 3.26%, these combined numbers give a total dividend return (or “Chowder Rule” number) of 12.9. This makes Eaton a Dividend Challenger (5+ consecutive years of dividend increases), one year away from being a Dividend Contender (10+ years), as maintained by Justin Law and the DRiP Investing Resource Center.
Payout ratio
The payout ratio for the past 5 years has ranged from 35.9% (in 2017) to 54.2% (in 2016). The 5-year average payout ratio has been 47.5%. The current dividend of $2.64 represents a payout ratio of 38.0%, using the Finviz trailing 12-month EPS of $6.94.
Debt
Eaton reported long-term debt of $6.753 billion as of Q2 2018. Measured by book value of $38.35 per share, debt is 40.5% of capitalization. Measured by equity market value of $81.00 per share, debt is 19.2% of capitalization. Standard & Poor’s gives Eaton a credit rating of A-. F.A.S.T. Graphs shows Eaton’s debt as 28% of capitalization. Better Investing shows long-term debt as 27.7% of capitalization.
High yield
Eaton’s high yield for the past 5 years averaged 3.9%. The highest yield achieved was 4.9% in 2016. The high yield in 2017 was 3.6%. The current yield is 3.26%.
Price range
Eaton’s stock price for the two-year period 2013-2014 traded in a relatively tight range of $55-80. The stock price drifted downward for the next two years (2015-2016), trading between $46.2 and $73.8. The stock price recovered in 2017, trading in a range of $66.6 to $81.6. The uptrend continued into the current 52-week price range of $69.82 to $89.85. The August 17 closing price of $81.00 is above the $79.84 mid-point of this range. The market dip on August 15 allowed me to establish a position at $79.15.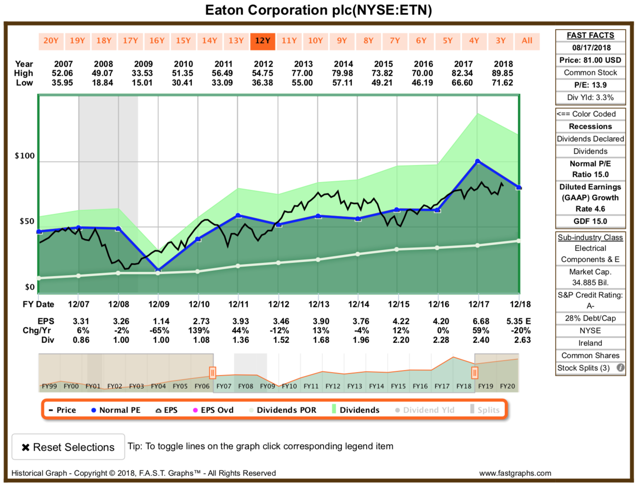 (Graph from F.A.S.T. Graphs)
The F.A.S.T. Graph above tracks Eaton’s diluted (GAAP) earnings.
Growth
Finviz projects EPS growth for the next 5 years to be 6.86%. F.A.S.T. Graphs estimates EPS for 2018 will be $5.35, a decrease from the strong 2017 EPS of $6.68, but still 27.4% above 2016 EPS of $4.20.
I encourage you to listen to the Q2 2018 earnings call on July 31, 2018. You can read along via the published transcript available from SA. Craig Arnold is an excellent communicator. Full year 2018 earnings per share guidance was increased by 10% to $5.20 to $5.40. Organic revenue growth is expected to be up 6% for the year, up from previous guidance of 5%. The pension plan is 96% funded. The company estimates EPS growth of 11% to 12% over the next three years. Arnold said,
“…our markets have returned to growth. The next few years will be much better than the last few.”
My experience in the stock market began when I joined an investment club in February 1982. It was a great time to enter the market. The Dow Jones Industrial Average was around 800. In some earlier articles, I’ve mentioned the Stock Selection Guide, which was developed in the early 1950s by George Nicholson, one of the founders of the National Association of Investment Clubs, now known as Better Investing.
The Stock Selection Guide was developed as a 2-page paper sheet with a semi-logarithmic graph on one side. The graph provided a way to post 10 years of data with the purpose of charting a possible earnings per share target for 5 years in the future. The SSG is now computerized, though some “old timers” still prefer completing the paper form with a pencil, a ruler and a calculator.
I’ve referred to the Stock Selection Guide in a few previous articles, and I’ve heard from numerous SA participants who have used the SSG. This is the first time I’ve provided a visual of the two-page tool on Seeking Alpha. On the graph below, the green line is revenue, the blue line is earnings per share, and the pink line is pre-tax profit. The black bars represent the price ranges from 2008-2018.
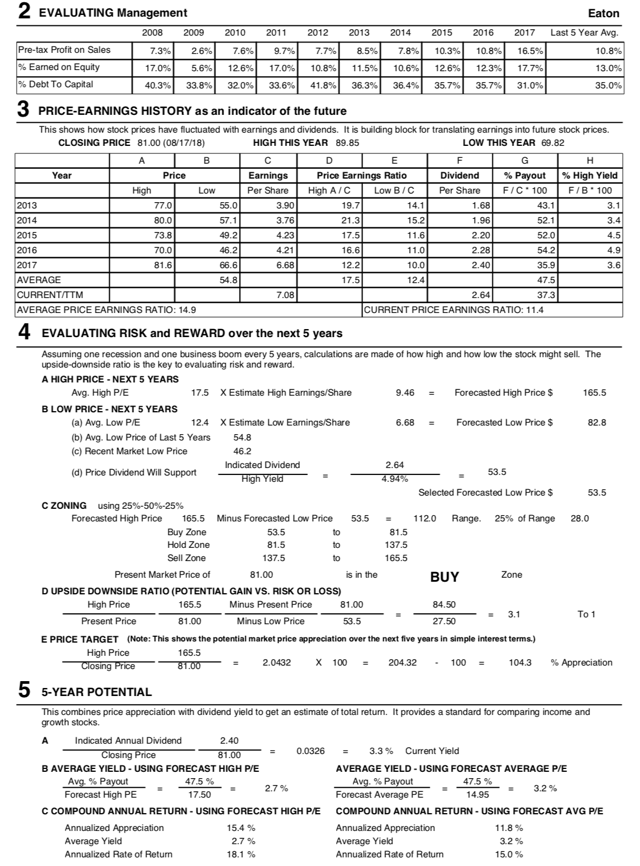
Using Better Investing’s Stock Selection Guide tool, I projected a possible 5-year high price for Eaton of $165.50. This is based on an estimated high EPS of $9.46 and a possible high P/E ratio of 17.5, which was the average high P/E for the past 5 years. I projected a possible low price of $53.50. This is based on an assumption that the annual dividend will be at least the current $2.64 and the yield will be no higher than 4.9%, which was the high yield for the past 5 years. This gives a possible price range for the next 5 years of $53.50 to $165.50. This may seem like an inappropriately wide range, but five years is a significant period of time and in a sense the range projects a “best case” and a “worst case” scenario. When the SSG was designed, the 5-year period was thought to encompass a complete economic cycle. Our present cycle is approaching twice that length of time.
The possible price range of $53.50 to $165.50 translates into a possible 3-to-1 upside/downside ratio from the recent price of $81.00.
I used a simple 1/3, 1/3, 1/3 division of this price range, dividing into “buy,” “hold,” and “sell” zones. This gives me a buy zone of $53.50 to $81.50, a hold zone of $81.50 to $137.50, and a sell zone of $137.50 to $165.50. It’s best to update the Stock Selection Guide at least annually, to see how the zones shift.
So, based on this study, Eaton is just below my maximum buy price of $81.50.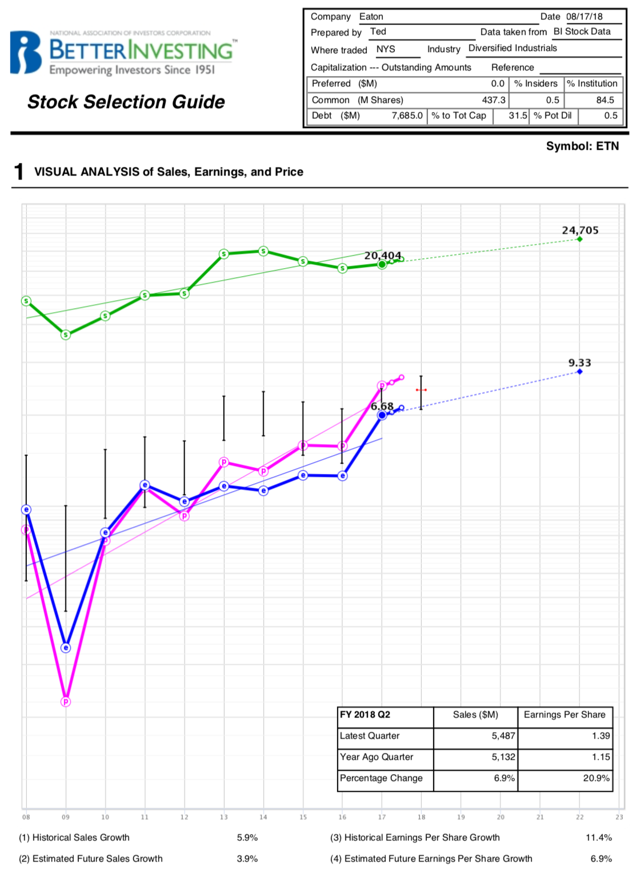
 (Stock Selection Guide from Better Investing)
The table below reflects the 44 individual equities in the portfolio. Price is the closing price on August 17, 2018. %Prt is the percentage of the portfolio market value represented by each holding. Div is the annual dividend or distribution per share/unit. Yield is the annual yield at the August 17 price. %Inc is the percentage of the portfolio income contributed by each holding. Buy is my target price to add more shares. (In many cases, this price is lower than it would be if I was establishing a position because some positions are already overweight.) S&P is the Standard & Poor’s credit rating, where available. CCC is the number of consecutive years of dividend increases as maintained by Justin Law and the DRiP Investing Resource Center.
72.20
3.77%
2.97%
3.96%
23
The portfolio includes 7 Vanguard ETFs as a “template” for the possible future shape of the portfolio, should I become unable or unwilling to manage a portfolio of common stocks. Also, this provides a “Plan B” for my heirs.
Price is the closing price on August 17, 2018. %Prt is each fund’s percentage of the portfolio market value. Dist is the annual distribution for the trailing 12 months. Yield is the annual income divided by the 8/17/18 price. %Inc is the percentage of portfolio income contributed by each fund. Target is my target market value allocation for each fund. M* is the number of stars given to the fund by Morningstar.
I think of the ETF allocation formula as an expandable “recipe.” ETFs could eventually comprise the entire portfolio by multiplying the current target market value allocation goals by 25, so that:
I’ve written a couple of recent articles about my strategy to include up to five closed end funds in the portfolio. The most recent CEF article was published on July 30, 2018.
Adams fills the fifth CEF slot in the portfolio
When the market took a slight breather on August 15, I added the fifth CEF: Adams Diversified Equity Fund, Inc. (NYSE:ADX) at $15.99. It is now 0.97% of the portfolio.
The fund has a long history
In 1840, Alvin Adams began hauling packages, bank drafts and other valuable cargo for a fee in the Boston/New York City area. The company was one of several express companies that grew with the expanding nation. However, in 1845, the federal government prohibited private companies from delivering letters for a fee. This could be done only by the U.S. Post Office. The freight business continued to grow and in 1854, Adams & Company merged with several other express companies to form Adams Express.
During World War I, the federal government briefly nationalized the railroads and express services by forming the American Railway Express Company. The government gave Adams and its two peers, American Express (AXP) and Wells Fargo (WFC), shares of a newly formed monopoly, the Railway Express Agency. In October 1929, the REA bought the shares of the three companies, and they each became investment companies. The Adams Express Company became a closed end fund in October 1929 and was in the unusual position of being flush with cash at the beginning of the Great Depression. The company had $72 million in assets at the end of 1929, at the beginning of one of the great “buyers’ markets” of all time.
So, if you ever wondered why three former package/freight delivery companies became players in Financials, the answer involves a wartime government monopoly and the timing of the Great Depression.
A new name
In 2015, Adams Express changed its name to Adams Diversified Equity Fund. I looked at Adams Express a few times over the years, but never seriously considered making an investment. However, as I was searching for the fifth CEF for the portfolio, I ran across George Spritzer’s now-paywalled article of May 14, 2017, which brought ADX back into my consciousness: “ADX: A Solid Closed-End Fund With Low Expenses And A 15% Discount.” George concluded his article with these words:
“In the current environment, it is getting harder to find good closed-end funds at attractive discounts. I believe that ADX is a good “default” choice now to park equity money while waiting for better opportunities to come along in other sector-oriented closed-end funds…”.
Management
Mark Stoeckle is CEO for two Adams Funds, ADX and the Adams Natural Resources Fund (PEO), which was also launched in 1929 as the Petroleum Corporation of America. In 1977, the name was changed to Petroleum & Resources Corporation in 1977, and then renamed Adams Natural Resources Fund in March 2015. It is the oldest energy closed-end fund. Stoeckle and his team manage both ADX and PEO from their Baltimore, Maryland office. (Photo of CEO Mark Stoeckle from ADX website)
Stoeckle has been CEO since 2013. He previously served BNP Paribas Investment Partners, co-founded 646 Advisors LLC, and worked in portfolio management for Liberty Financial Corporation and MFS Institutional Advisors.
Good performance
Stoeckle was interviewed by The Motley Fool in 2015 when the name changes were being implemented. The summary of that article stated:
“Still, even with the name change, what really matters to investors at the end of the day is performance. With average annual returns of 7.6% on a market-price-return basis over the past decade, Adams Express ranks in the top 10% of large-blend funds.”
Holdings
As of June 30, 2018, ADX assets were $1.81 billion, spread over 86 holdings with a median market cap of $125.5 billion. The fund was 98% invested in U.S. companies. The largest sector was Information Technology, at 25.8%: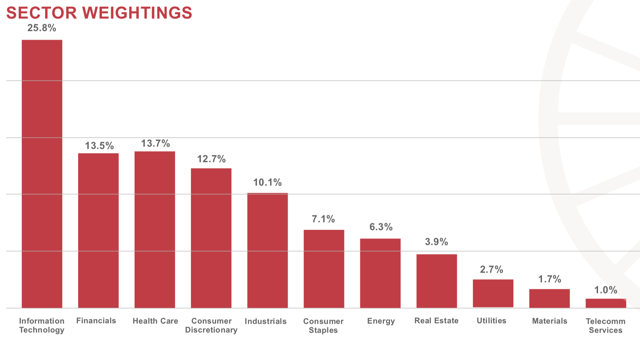 The bar graph (above) is from the ADX Factsheet, which indicates that 53.0% of the portfolio was in three sectors: Information Technology, Financials and Health Care.
The June 30, 2018, Factsheet also indicates that the ten largest holdings comprised over 30% of the fund: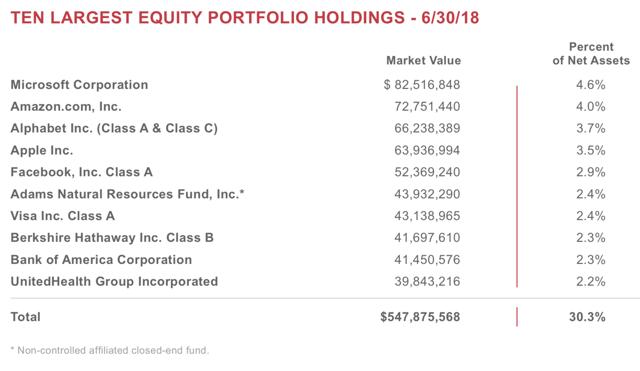
Dividend dates and policy
Dividends are paid quarterly, on or about March 1, June 1, September 1 and in late December. The payments for the first three quarters have been $.05 each, with a large payment in December. The company’s stated dividend policy is to annually distribute an amount equal to 6% of the average month-end market price of the stock for the trailing 12 months, calculated as of October 31.
2017 distribution rate was 9.8%
A company news release on November 9, 2017, gives a good description of the company’s policy and how it implemented the plan last year. The year-end distribution was $1.23, bringing total 2017 distributions to $1.38. The year-end distribution came from $1.15 in capital gains and $.08 from income. The 2017 distribution rate was 9.8%, based on the fund’s market price.
Why I chose ADX
The 2017 annual distribution was the 53rd consecutive year that ADX paid capital gains and the 82nd consecutive year it has paid dividends. The fund does not use leverage. The total annual expense ratio is 0.56%.
I chose ADX for the fifth CEF portfolio slot for the following reasons:
The target percentage allocation is 1.0% of the portfolio’s market value for each of the 5 CEFs in the portfolio. Price is the closing price on August 15, 2018. %Prt is each fund’s percentage of the portfolio’s market value. Dist is the amount paid in dividends or distributions for the trailing 12 months. Yield is the annual payout divided by the 8/15/18 market price. %Inc is the percentage of the portfolio income contributed by each CEF. Discount is the percentage difference between the fund’s net asset value and market price. Fee is the annual fee charged by the fund. M* is Morningstar star rating for each CEF, where available.
Here are the 5 closed end funds in the portfolio:
I’m trying to limit my active stock universe (that I track on my spreadsheet) to 50 companies. There are now 44 companies in the portfolio, and I am following 6 other companies on my watchlist:
Colgate-Palmolive (CL), in the Consumer Staples sector, sells 40% of the planet’s toothpaste. At $67.50, the $1.68 annual dividend yields 2.49%. The dividend has been raised for 55 consecutive years. The S&P credit rating is AA-. My target price is $62.22.
Emerson Electric (EMR), in the Industrials sector, yields 2.62% at $73.97 and an annual dividend of $1.94. The dividend has been raised for 61 consecutive years. The S&P credit rating is A. My target price is $64.67.
Target (TGT), in the Consumer Discretionary sector, yields 3.12% at $82.03 and an annual dividend of $2.56. The dividend has been raised for 50 consecutive years. The S&P credit rating is A. My target price is $67.03.
Air Products and Chemicals (APD) is in the Materials sector. The annual dividend is $4.40 and at $164.72, the yield is 2.67%. The dividend has been raised for 36 consecutive years. The S&P credit rating is A. My target price is $146.67.
Leggett & Platt (LEG) is a furniture manufacturer in the Consumer Discretionary sector. The annual dividend is $1.52, and at $44.60, the yield is 3.41%. The company has raised the dividend for 47 consecutive years. The S&P credit rating is BBB+. My target price is $41.08.
Genuine Parts (GPC) operates NAPA auto parts stores and it has an industrial component. It is in the Consumer Discretionary sector. The annual dividend is $2.88, and at $98.89, the yield is 2.91%. It has raised the dividend for 62 consecutive years. The company does not have a credit rating by S&P. My target price is $92.90.
I am not advocating the purchase or sale of any security. I offer ideas for stocks to study. These articles are a journal of my effort to design and maintain a retirement income portfolio with a relatively safe stream of growing dividends. I seek companies with histories of rising dividends, strong financials, and solid future prospects. Your goals and risk tolerance may differ, so please do your own due diligence.
Your opinions are important. Your comments enrich our discussion. I always learn from our Seeking Alpha conversations.
If you are not yet a follower, I invite you to click the “Follow” button at the top of the page. After you click “Follow,” you can check “Get Email Alerts,” and you will receive an email when an article is published.
This article was written by
Disclosure: I am/we are long JNJ, MSFT, XOM, AAPL, WMT, ADP, PFE, MRK, PG, MMM, BLK, CSCO, RY, TD, TM, NWN, PEP, ITW, IBM, TXN, CMI, BNS, KMB, QCOM, SPG, CDUAF, FTS, CLX, PPL, WEC, ETN, ABBV, NNN, O, SKT, EPD, BIP, BEP, VTR, BCE, T, WPC, MAIN, APLE, ADX, ECF, IFN, RMT, RVT, VTI, VEA, VWO, VYM, VYMI, VOE, VBR. I wrote this article myself, and it expresses my own opinions. I am not receiving compensation for it (other than from Seeking Alpha). I have no business relationship with any company whose stock is mentioned in this article.

