The relation between the stock market and money supply has been established for decades. Before America’s massive quantitative easing, the influence of money supply on the market was relatively mild. Before 2008, federal rates kept at a reasonable level (4%-5%) that constrained the rapid rise of the market. Since 2008, the effective Fed rates fell swiftly to near zero and maintained at that level for years. Now, a strong suppressive force to the market has been removed. The stock market is set free to explore, much depends on the money supply in the market.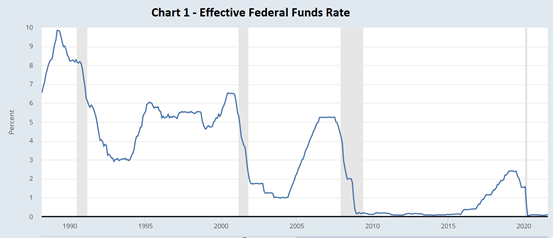
(Source: Federal Reserve)
The market in the post-2008 period set out a magnificent era. On the one hand, interest rates kept crawling on the ground. On the other hand, liquidity kept hiking. In the spring of 2009, the stock market was to finish its last dive and ready to rebound. Money supply has dictated the market as interest rates were willfully destroyed.
Chart 2 illustrates how the two variables, M2 money supply and S&P 500, have been proceeding since January 2008. Not only were they growing almost in phase, but they also exhibited an increase in pace since the start of 2020. With Biden’s 2020 ‘unlimited QE’ package, S&P 500 has surged 74.99% by August 2021.
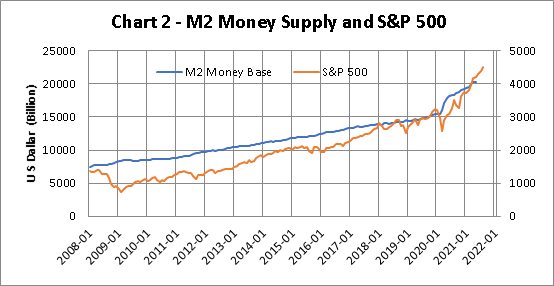
(Source: Federal Reserve and stooq.com)
Money Supply can be defined as the total of money stock circulating in an economy. The circulating money involves the currency, printed notes, money in the deposit accounts and the form of other liquid assets. Cash is certainly one form of money. So are checks and credit cards. Rather than using a single way of measuring money, the finance circle offers broader definitions of money based on liquidity.
Thus, there are two definitions of money: M1 and M2 money supply. M1 money supply includes those monies that are very liquid such as cash, demand deposits, and traveler’s checks. The M2 money supply is less liquid and includes M1 plus savings and time deposits, certificates of deposits, and money market funds. Individuals holding government bonds are also part of the M2 category.
For this study, the money supply variable used is confined to M2. It suits our choice because M2 includes everything in M1. In short, M2 is money that one can withdraw and spend, but which requires a greater effort to do so than those items listed in M1.
We start by examining the scatter plots of S&P 500 vs M2 money supply at different lags of M2. Underneath provides all the plots ranging from lag 1 to lag 12. We don’t have to go further because the best correlation has been identified at lag 8, implying that the best linear regression model can be constructed at that lag.
Chart 3 – Scatter Plots at Different Lags of M2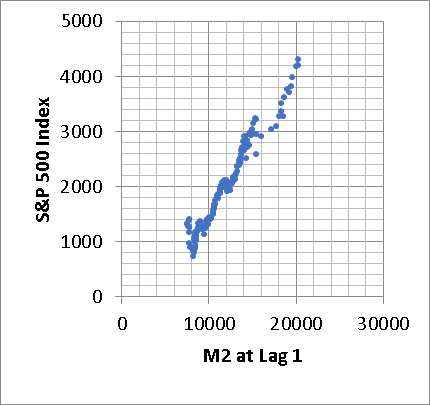
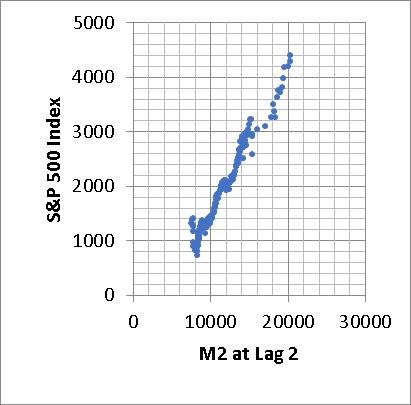
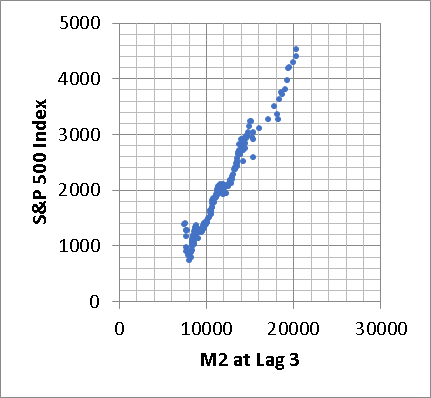
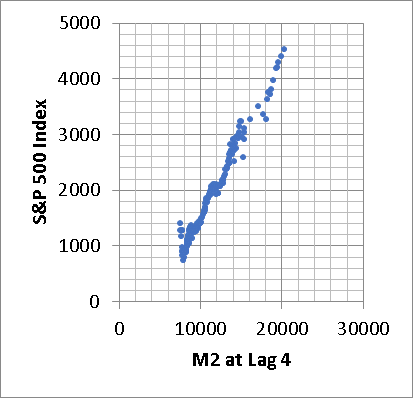
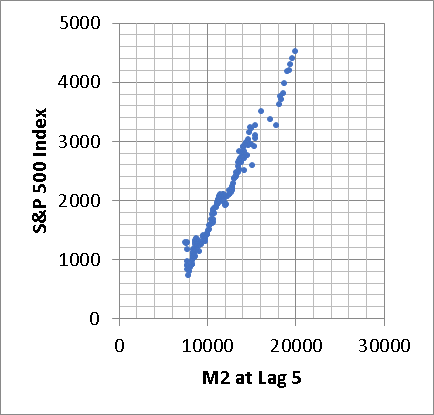
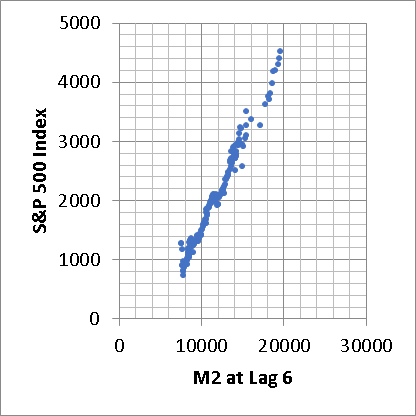
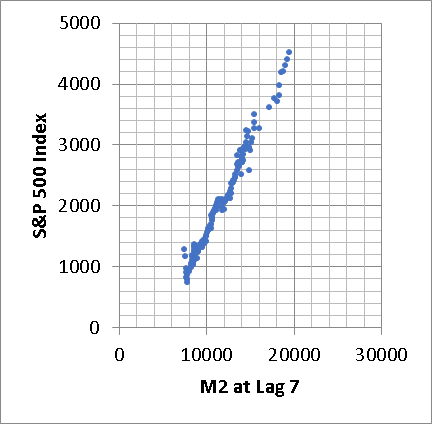
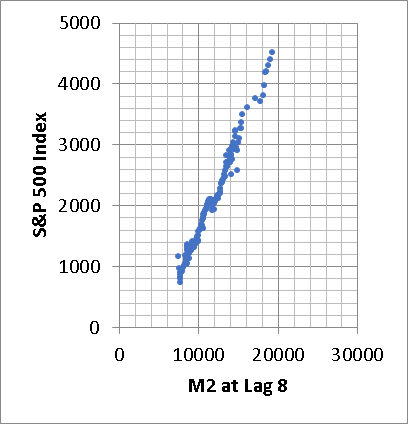
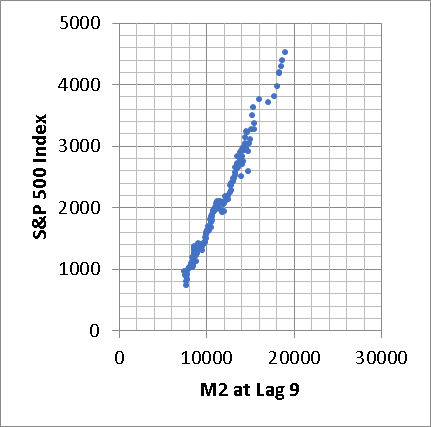
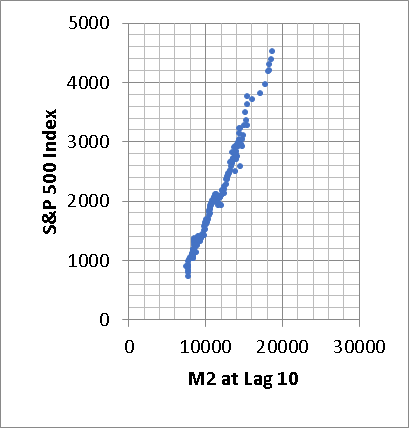
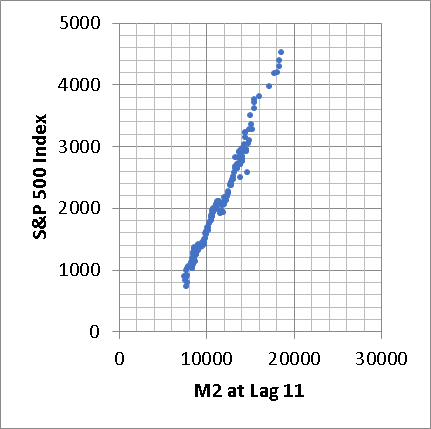
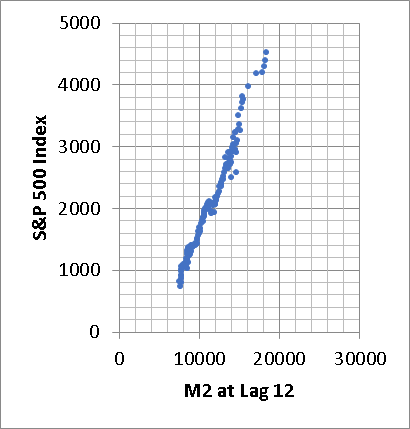
(Source: Author’s presentation via Excel spreadsheet)
The accompanying table summarizes the regression results. Though the scatter plots at various lags of M2 resemble much under the naked eyes, their correlations with S&P 500 improve from lag 1 through lag 8. The highest correlation attained is 0.990830 that occurred at lag 8 of M2. The corresponding linear regression model has the equation Y = 0.300X – 1431 with an R2 of 98.1%. This means that the model has been able to pick up 98.1% of the variations due to changes in M2.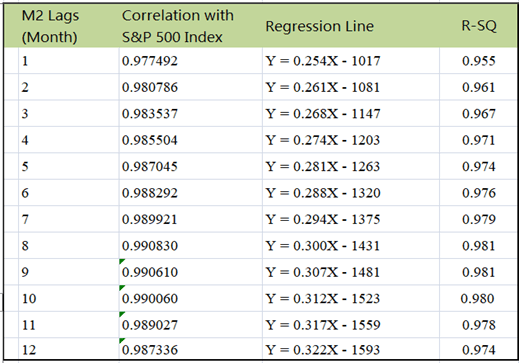
(Source: Author’s computations)
So far I have established the connection between S&P 500 index and the M2 money supply. It is a phenomenon valid since 2008. Here I am using it to predict the S&P 500 for the remaining months of 2021. Readers can then get a feel for the pace of the market. As chart 4 depicts, S&P 500 index can reach 4651 points by the end of December 2021.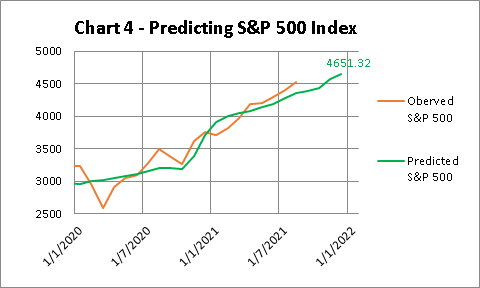
(Source: Author’s presentation via Excel spreadsheet)
Some may argue extrapolation based on a single-factor model may oversimplify the complexity of the financial market. But an R2 as high as 98.1% is scarcely found in financial modeling and should never be ignored by investors.
We are now at the crossroad of policy dilemmas. While the Fed is attempting to taper its balance sheet, at the same time it is seeking to raise its interest rates in response to escalating inflation. Realization of either factor can hurt the market by bringing about a correction to the S&P 500 index. Lastly, interested readers can download from me the relevant Excel file PRINTMONEY.xlsx, if they want to know more about it.
This article was written by
Disclosure: I/we have no stock, option or similar derivative position in any of the companies mentioned, and no plans to initiate any such positions within the next 72 hours. I wrote this article myself, and it expresses my own opinions. I am not receiving compensation for it (other than from Seeking Alpha). I have no business relationship with any company whose stock is mentioned in this article.

